
The cryptocurrency industry as a whole is crashing. What is the explanation for this? Tesla- Invested $1.5 billion in Bitcoin in February, launching a Bitcoin rally that was harmed by Tesla’s declaration that it will no longer accept Bitcoin as payment due to environmental concerns about crypto-mining. According to Reuters, China has prohibited its financial institutions and payment firms from providing cryptocurrency-related services. As a result, BTC/USD dropped more than 30% and briefly fell below $30,500. The world’s most valuable cryptocurrency then found support and recovered from its $30,000 low. Bitcoin’s downside potential has remained tilted towards the January crash price of $30,000 after it broke through the crucial $42,000 mark, but it has now recovered. BTC is currently floating around the $40k mark, with the possibility of a resumption of the upward trend if government regulations on crypto are relaxed. Bitcoin has attempted numerous corrections, but a 20% dive to a three-and-a-half-month low is a crash. More panic selling may occur, resulting in a large sell-off.
Key Levels
Resistance Levels: $55,000, $50,000, $45,000
Support Levels: $30,000, $25,000, $20,000
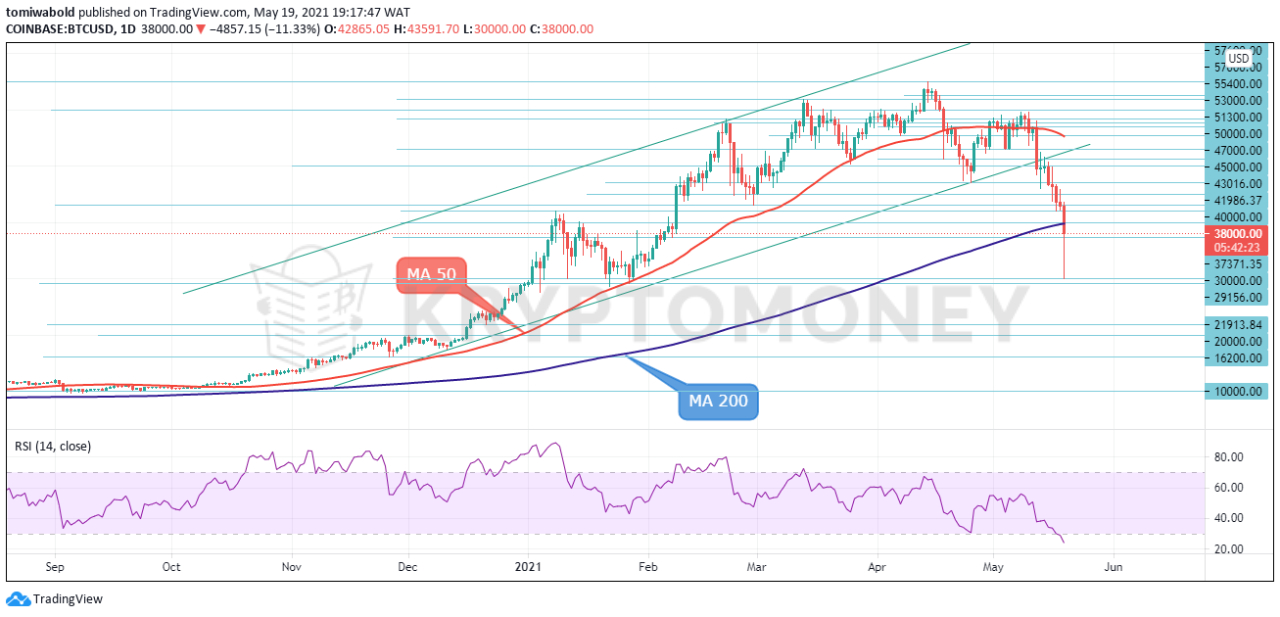 BTC/USD Daily Chart
The selloff in global crypto markets intensified further as BTC scored the largest single-day point drop in history to $30,000 support level after breaching the strong moving average (MA 200) base. Technically, BTC/USD powered through key near-term cluster support level at $42,000 cluster support, as well as MA 200 at $40,000. The development suggests that correction from $64,899 through both moving averages (MA 50 & MA 200) is at least one larger degree.
On the other hand, the rebound from $30,000 would probably be a return back into the uptrend from the January 2021 rebound of $29,156 low to February 21 high of $58,367. If that’s the case, BTC could head to 38.2% retracement of $30,000 to $42,000 at $38,000, which is close to MA 200 (now at $40,000). That’s the point where BTC would get some solid support to form a base for the next surge up.
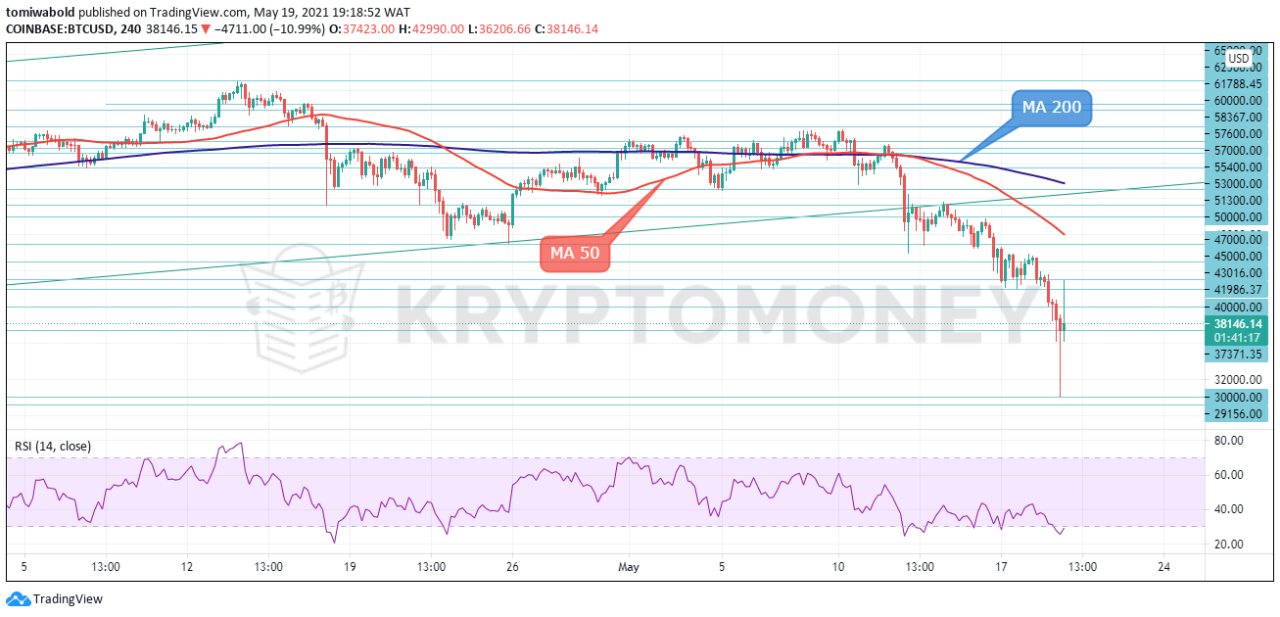 BTC/USD 4-Hour Chart
From the 4-hour chart perspective, the scenario implies BTC/USD trading in a bear market beneath short-term moving average (MA 50 and MA 200). Bitcoin has dropped below the psychological $40,000 support mark and is now trading at its lowest level since February of this year at the lowest point of the chart. The BTC/USD pair is expected to fall towards $33,000 before reversing.
The short-term Relative Strength Index is highly oversold and has been on the low. After sellers failed to break the $30,000 support mark, Bitcoin is attempting to recover higher into the $42,000-$43,000 channel. If successful, BTC’s recent crash will be short-lived while the bulls may take the reins back. The BTC/USD pair is only bullish while trading within the $42,000-$48,000 range.
Note: Kryptomoney.com is not a financial advisor. Do your research before investing your funds in any financial asset or presented product or event. We are not responsible for your investing results
Image Credit: Shutterstock


Keep in mind that we may receive commissions when you click our links and make purchases. However, this does not impact our reviews and comparisons. We try our best to keep things fair and balanced, in order to help you make the best choice for you.