
The cryptocurrency market continues to have an impressive week, with the lead crypto Bitcoin (BTC) taking out significant barriers to registering fresh yearly highs beyond $17,800. BTC upside traction took off from $16,000 and hints at a possible spike to a new 2020 high. Its anticipated correction is on the back foot as the path of least resistance on BTC/USD stays upside to $20k. As Bitcoin (BTC) edges higher its market cap surged to $324 billion, with $36 billion traded in the past 24 hours. The current BTC/USD spot price is up 6.5% at $17,661 from the day’s beginning but higher nearly 250% from March 2020 lows. Several on-chain metrics seem to support the Bitcoin rally in the short to long-term. The infamous Stock-to-Flow Bitcoin model by PlanB puts BTC price at least $100,000 by the end of 2021. Glassnode’s Entity-adjusted LTH-NUPL has also flipped bullish since July 2020 and indicates sentiment of market participants ranging from capitulation to euphoria on the Bitcoin price increase, however, participants haven’t hit the euphoria phase yet.
*BTC upside traction took off from $16,000 and hints at a possible spike to a new 2020 high
*Its anticipated correction is on the back foot as the path of least resistance on BTC/USD stays upside to $20k
*Several on-chain metrics seem to support Bitcoin rally in the short to long-term
Key Levels
Resistance Levels: $20,000, $19,000, $18,000
Support Levels: $16,000, $15,000, $14,000
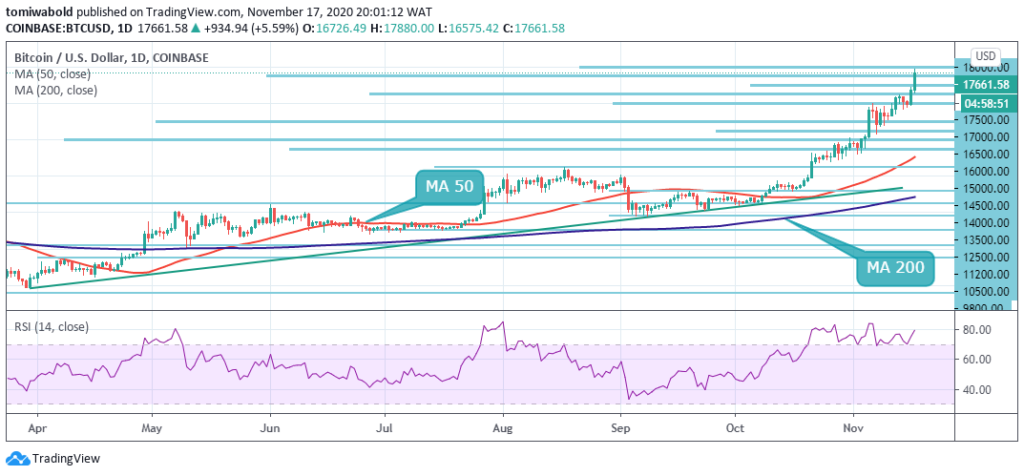 BTC/USD Daily Chart
BTC upside traction took off from $16,000 and hints at a possible spike to a new 2020 high. The approach towards the $18,000 mark while drawing closer to the all-time high at $20,000 indicates an unrelenting bullish momentum putting anticipated correction on the back foot. There are no considerable resistance areas located above the current price and BTC may skyrocket if the buying pressure increases past the $18,000 mark.
The bullish scenario will be invalidated if sellers gain traction to pull Bitcoin under $16,000. However, the up-trending MA 50 and MA 200 stays steady from $13,000 and $11,000 respectively in the long term to support the bullish outlook on the daily chart and stands to act as a springboard in the event of a fall for traders to buy the dip and still make profits during bull markets.
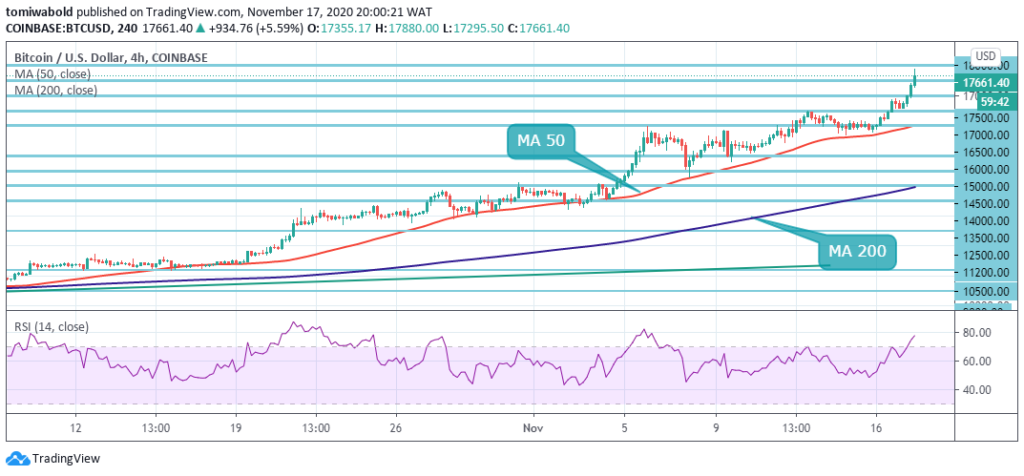 BTC/USD 4-Hour Chart
Technical analysis on the 4-hour chart shows Bitcoin trading towards the high of its yearly trading range, with BTC/USD finding interim resistance from the $18,000 level. A breakout above the $18,000 level exposes further upside towards the $19,000, and possibly the $20,000 all-time high level.
To the downside, any technical pullbacks anticipate strong support from either the 4 hour MA 50 or the $16,000 level. The BTC/USD pair is only bullish while trading above the $16,000 level, key resistance is found at the $18,000 and the $20,000 levels. If the BTC/USD pair trades below the $16,000 level, sellers may test the $15,000 and MA 200 at $14,000 levels.
Note: Kryptomoney.com is not a financial advisor. Do your research before investing your funds in any financial asset or presented product or event. We are not responsible for your investing results
Image Credit: Shutterstock


Keep in mind that we may receive commissions when you click our links and make purchases. However, this does not impact our reviews and comparisons. We try our best to keep things fair and balanced, in order to help you make the best choice for you.
