
Bitcoin has dropped about 10.0 percent in the last 48 hours, as the cryptocurrency herd swarmed for the nearest exit due to uncertainty globally. Earlier, the fear of spillover from China Evergrande Group’s debt problems took Bitcoin on a severe drop below $40,000. The recent price movement shows that Bitcoin isn’t immune to the selloff in risky assets across traditional markets. A flood of sell orders on the BTC/USD pair shattered the $43,000 to $40,000 levels of support, liquidating more long positions than expected. However, as of the American session on Wednesday, the BTC has snapped a three-day losing trend, climbing 3.5 percent above $44,000 intraday high. It had previously dropped to $39,600 overnight. BTC/USD is currently trading at $43,573, with the bulls defending the psychologically critical $40,000 level. Depending on how the Evergrande situation plays out with markets, Bitcoin could continue finding safe-haven buyers as China calmed global market fears amid the risk-on mood.
Key Levels
Resistance Levels: $50,000, $47,000, $45,000
Support Levels: $42,000, $40,000, $37,500
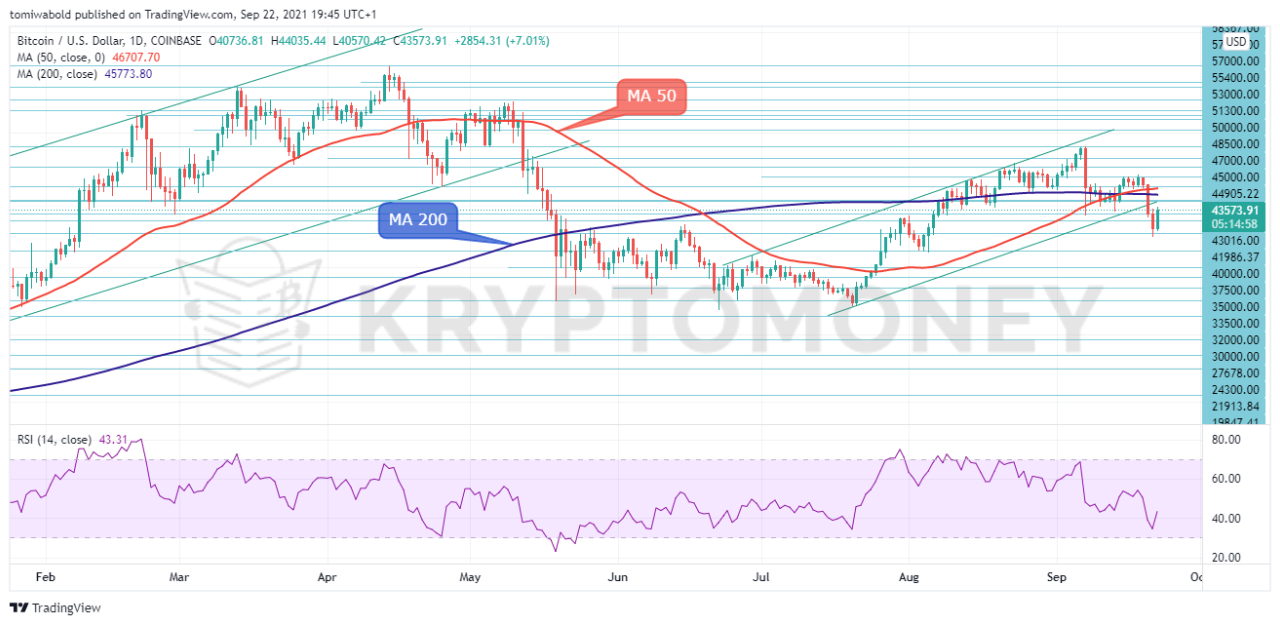 BTC/USD Daily Chart
Bitcoin is strengthening, and the BTC/USD pair is rising. It began trading at $40,736 on Wednesday, Sept. 22, and may end above $44,000 on the daily chart. The movement stays strong, at above 10 percent a day. And must be remembered that it was below $40,000 as of the previous day. On Tuesday, downside concerns pushed the BTC/USD lower.
As a result, it dropped to a new low of $39,600 on the market. Buyers may drive the price higher during the next trading session after BTC bounced off the lower line of the downward channel today. However, for optimistic traders, the moving average (MA 200) at $45,900 may give resistance throughout this session. Bitcoin must retake the moving average (MA 50) at $47,000 and consolidate before a collective sigh heaved.
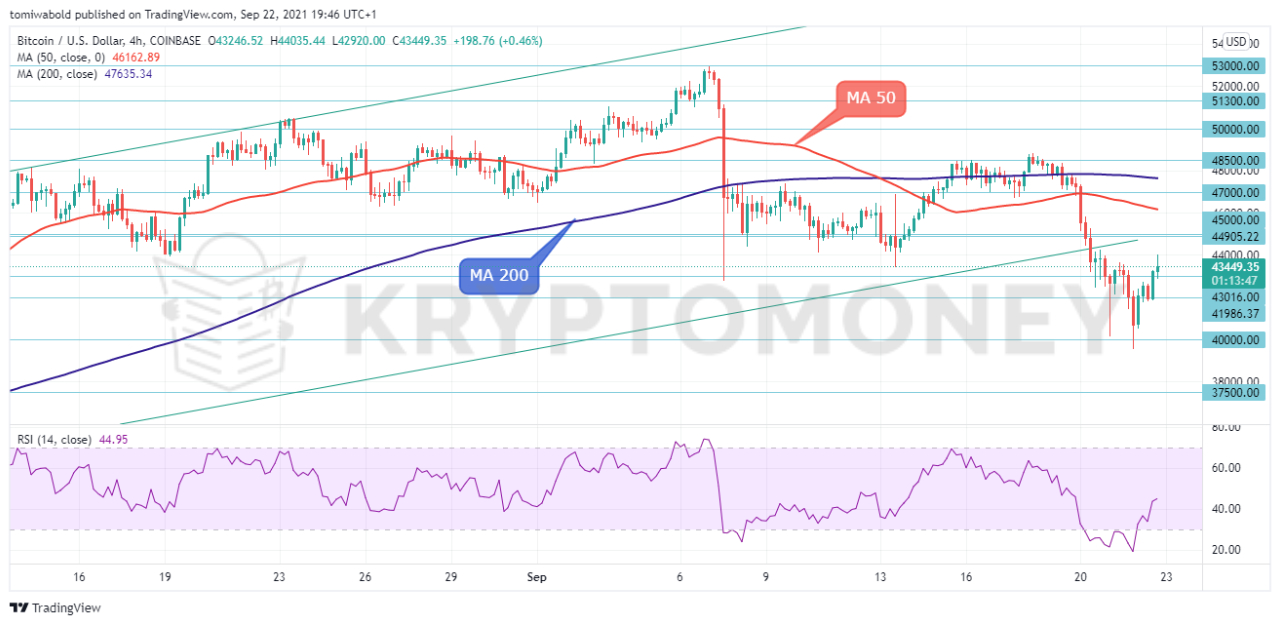 BTC/USD 4-Hour Chart
Earlier, leveraged buyers have been put on edge by the potential collapse of the ascending trendline and horizontal support at $43,000. Meanwhile, during today’s session, a rapid rally has been prompted by a combination of short-term profit-taking and buying-the-dips mentality from the $40,000 lift-off zone.
The first hurdle ahead is $45,000 that the bulls will need to break through the 4-hour moving average (MA 50) around $46,000 to make a turnaround. Meanwhile, an overbought RSI could stifle the V-shaped surge. In the event of a relapse, $42,000 is new immediate support. Today’s close above the round number of $44,000 may push buyers to cover their positions and dampen bearish bias.
Note: Kryptomoney.com is not a financial advisor. Do your research before investing your funds in any financial asset or presented product or event. We are not responsible for your investing results
Image Credit: Shutterstock


Keep in mind that we may receive commissions when you click our links and make purchases. However, this does not impact our reviews and comparisons. We try our best to keep things fair and balanced, in order to help you make the best choice for you.
