
The cryptocurrency market is turning bullish once more after recent pullbacks. Bitcoin (BTC) is leading the pack after reclaiming the ground past $19,000. BTC/USD has lived through peaks and troughs in the present week. The lead crypto hit another multi-year high of $19,873 and got close to the all-time high of $20k in the prior session. After its recent attempts, the price consolidates at $19k as BTC/USD prepares to defeat the dominant barrier at $20k. BTC is attempting to stabilize after hitting an intraday high at $19,340. The Bitcoin (BTC) market cap is currently $350 billion, with $43.1 billion traded in the past 24 hours. The current spot price is down almost 2% in 24 hrs while hovering at $19,000 during the time of this post. Bitcoin is in a firm bull trend for the moment, with analysts noting that institutional buying may lead to a firmer floor as any dips are bought aggressively. Institutional crypto fund manager Grayscale is more aggressive and sees Bitcoin bull run. As outlined in a Grayscale report, the trust’s holdings are worth over $9 billion and represent 2.69% of Bitcoin’s (BTC) outstanding supply and market cap.
*The lead crypto hit another multi-year high of $19,873 and got close to the all-time high of $20k in the prior session
*BTC is attempting to stabilize after hitting an intraday high at $19,340
*Institutional crypto fund manager Grayscale is more aggressive and sees Bitcoin bull run
Key Levels
Resistance Levels: $20,500, $20,000, $19,500
Support levels: $18,000, $17,000, $16,200
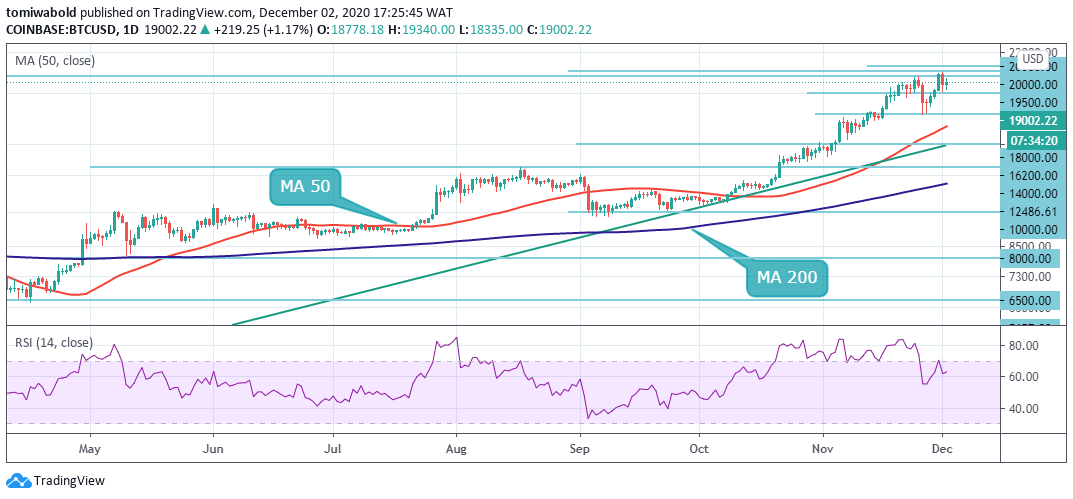 BTC/USD Daily Chart
The sharp drop seen the day before saw BTC/USD hit $18,109 after 3 consecutive days of a bull run to a high of $19,873. On the daily chart, the Relative Strength Index (RSI) has shown a decisive rebound. While a technical correction is likely shortly, buyers may struggle to control the price if it doesn’t return to $19,500.
Above this level is the next resistance beyond its all-time high of $20,000. On the other hand, initial support is located at $16,200 (static level) ahead of the daily MA 50 zone at $15,300, which could act as a protection against unexpected sell-offs. While the technical outlook suggests a correction after the recent sharp decline, the BTC/USD upside target remains at $20,000 and above.
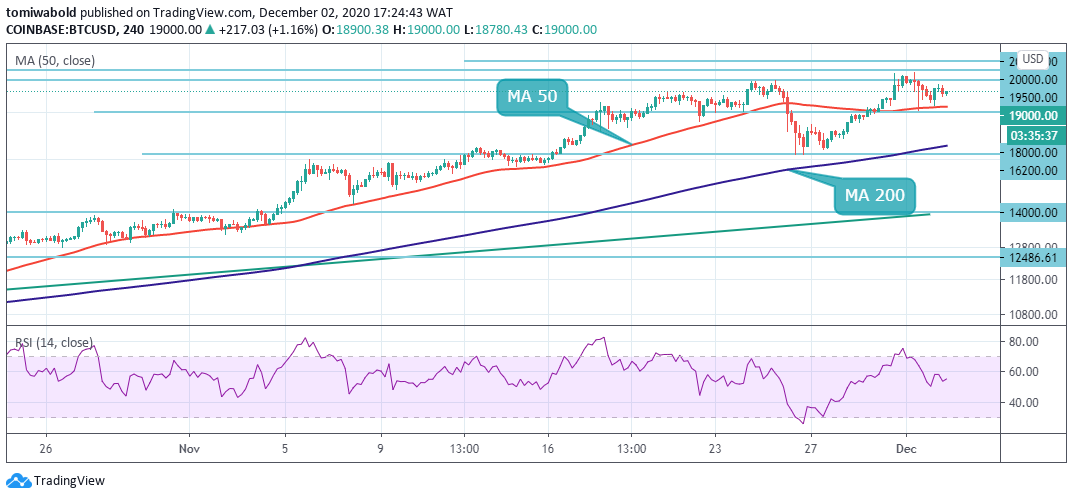 BTC/USD 4-Hour Chart
Bitcoin has staged a short-term pullback after setting a new multi-year trading high under the psychological $20,000 level. It is attempting to stabilize above the $19,000 marks, following the steep drop towards the $18,000 support area. Technical analysis shows that BTC/USD bulls may test towards the $20,000 level and beyond if price stabilization above the $19,500 level occurs.
To the downside, a daily price close under the 4 hour MA 50 and $18,250 level could cause the BTC/USD pair to plunge towards the $17,500 region. The BTC/USD pair is only bullish while trading above the $18,500 mark, resistance is at the $19,500 and the $20,000 levels. If the BTC/USD pair trades under the $18,500 mark, sellers may test the $18,000 level and beneath the $17,500 mark.
Note: Kryptomoney.com is not a financial advisor. Do your research before investing your funds in any financial asset or presented product or event. We are not responsible for your investing results
Image Credit: Shutterstock


Keep in mind that we may receive commissions when you click our links and make purchases. However, this does not impact our reviews and comparisons. We try our best to keep things fair and balanced, in order to help you make the best choice for you.
