
After rebounding from the recent Tesla-induced crash on May 12, Bitcoin price has remained relatively stable, trading sideways. The lead crypto BTC is consolidating above a fresh one-week low of $46,000, following a 15% decline on Wednesday that generated an initial reversal signal on the formation of a large bearish candle under the moving average (MA 50). Following the sell-off, BTC’s price returns higher with a surprise but the recovery stays fragile beneath the $53,000 psychological zone. Buyers regained traction just when price re-enters bullish market zone as BTC/USD trades higher. At the time of this post, the overall outlook for the pair stays in a range at $50,300 having reached an intraday high of $51,569 on Friday. Bitcoin retains its no. 1 position on Coinmarket cap with a market cap of $942 billion and $58.35 billion in trade volume over the past 24 hours. As traders digest the news from Tesla’s announcement on Wednesday, that it will no longer accept Bitcoin as payment causing a price drop, Bitcoin (BTC) ignores Elon Musk and is rising from oversold levels. Demand has continued to increase, providing a boost to cryptocurrency’s adoption.
Key Levels
Resistance Levels: $60,000, $57,000, $53,000
Support Levels: $50,000, $47,000, $43,000
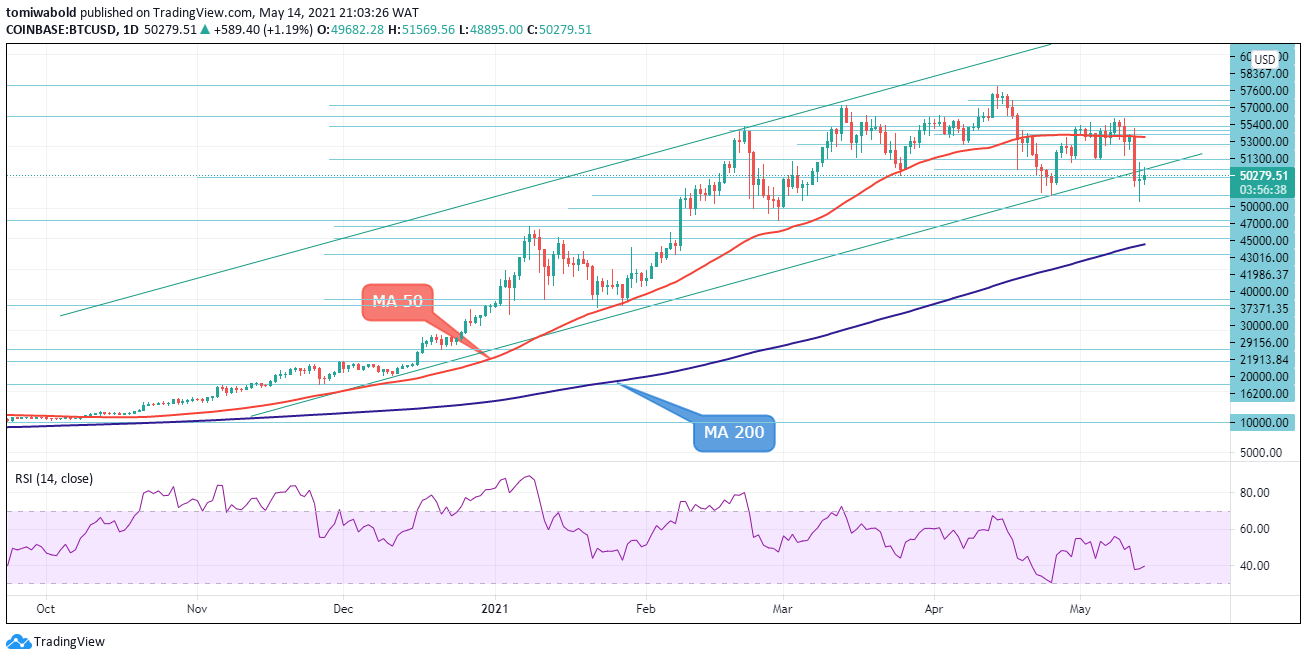 BTC/USD Daily Chart
Following reports that Tesla will no longer support Bitcoin, the BTC/USD pair plummeted. It fell to $46,000, its lowest point since March 1. It then returned to its current level around $50,300. The pair has slipped below the moving average (MA 50) for the 3rd time since mid-April on the daily chart. Also, the relative strength index (RSI) has climbed marginally back to the oversold level of 40.
As a result, buyers rush to buy the falls, and the pair is expected to resume its upward trend. If the price drop below $46,000, the bullish claim would be invalidated. Fresh recovery has so far been capped by a $52,000 round figure, with a daily close above here to signal that bulls are gaining traction, however, the downside is expected to remain at risk as long as the price holds below key barriers at $53,000 psychological zone.
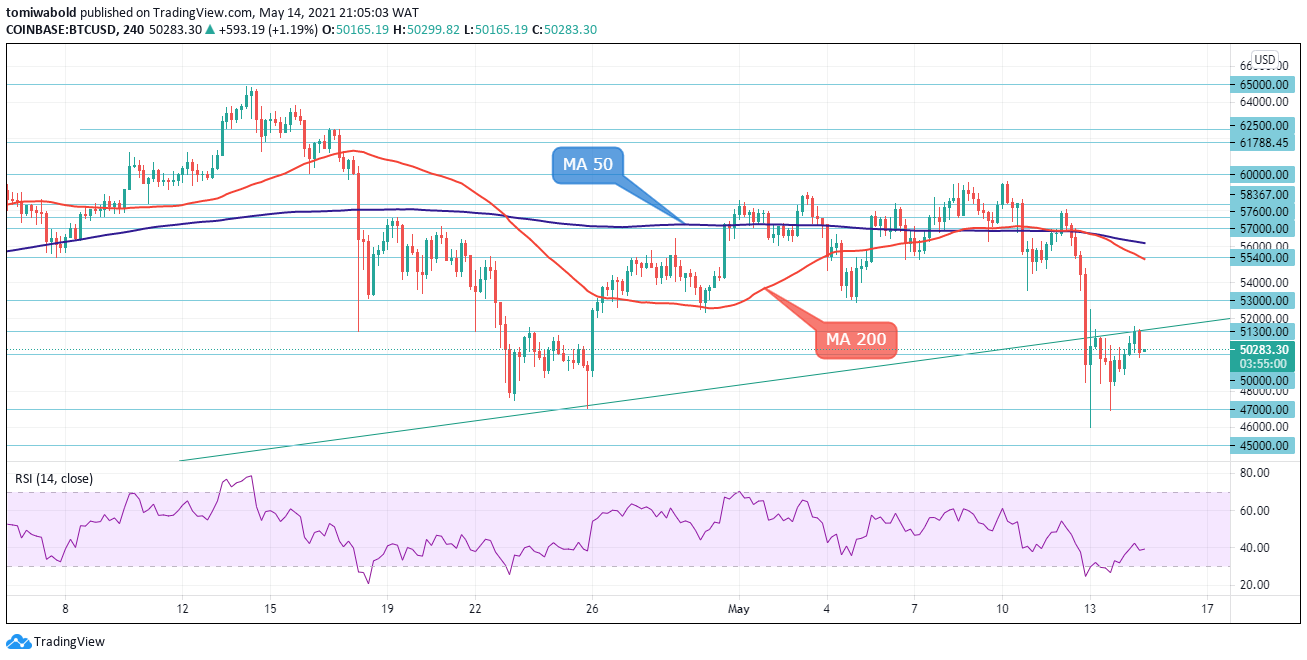 BTC/USD 4-Hour Chart
In the 4-hour chart’s perspective, after a recent price drop towards the $46,000 support range, BTC is attempting to rebound higher on the cryptocurrency market on Friday. From a technical standpoint, the $51,300 level is critical because it is the gateway into the price channel pattern. If the price does not stay below this amount, a technical recovery towards the $55,400 resistance area is possible.
Although Bitcoin remains in consolidations after its all-time highs of $64,899 on Apr.14 which suggests the short-term trend is weakening. The BTC/USD pair remains bullish if it is trading above $53,000; the main resistance thresholds are the moving average (MA 50) at $54,500 and $57,000 levels. Sellers can test the $50,000 and $46,000 levels if the BTC/USD pair trades below $53,000.
Note: Kryptomoney.com is not a financial advisor. Do your research before investing your funds in any financial asset or presented product or event. We are not responsible for your investing results
Image Credit: Shutterstock


Keep in mind that we may receive commissions when you click our links and make purchases. However, this does not impact our reviews and comparisons. We try our best to keep things fair and balanced, in order to help you make the best choice for you.
