
Bitcoin bulls and bears continue battling below the $50,000 psychological zone with an overall mixed risk appetite giving investors concern in the absence of breaking news or impactful tweets. However, the potential of a BTC rally on Christmas Eve remains positive, as risks of a local drop decrease. The discovery of the $45,000 support had also triggered a short squeeze, leading to a Santa rally on Bitcoin. BTC is higher today, thanks to short-covering sharply lifting the lead crypto to a $49,339 intraday high. The pull of buy-the-dip is stronger than anything as investors watch with caution. At the time of analysis, BTC/USD is exchanging price at $48,656 after its earlier bounce from daily moving average (MA 200) and lows of $46,645. As seen on sentiment measured by Crypto Fear & Greed Index, Bitcoin shifts from ”extreme fear” in 24 hours to “fear” following marginally improving market sentiment. With all uncertainty, the price of Bitcoin has gained above 7% in 24 hours as it looks to sustain its rally.
Key Levels
Resistance Levels: $57,000, $53,000, $50,000
Support Levels: $45,000, $43,000, $40,000
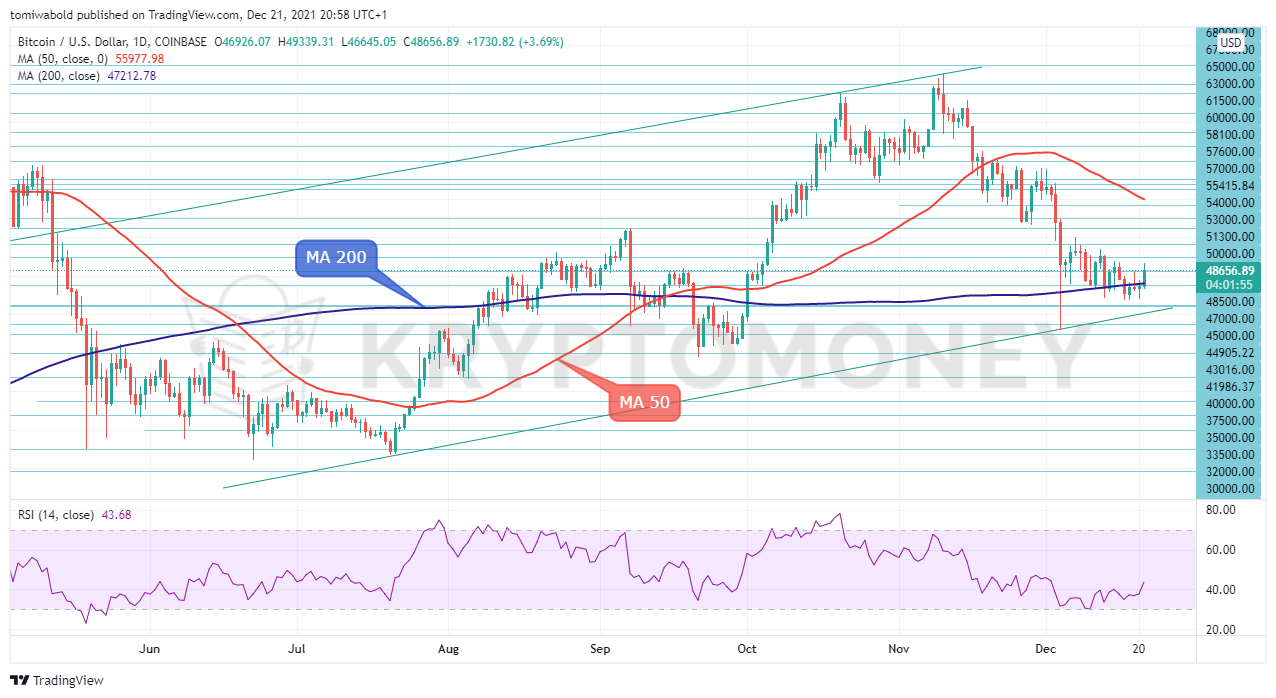 BTC/USD Daily Chart
BTC/USD changed course to the upside again after almost touching a monthly low of $42,333 on Tuesday, with the price currently testing a close above the moving average (MA 200) at $49,339. The main target is above 50% retracement of the latest downfall, which is blocking bullish actions around $50,000 and $52,000 since early December.
However, momentum indicators question whether the bulls have enough power to knock down that wall. The RSI continues to consolidate its latest upturn, unable to extend above the 50 neutral mark. Nevertheless, if the price exceeds the $50,000 barrier, BTC could gain further buying traction, below the bears may attempt to crack the floor at $45,000.
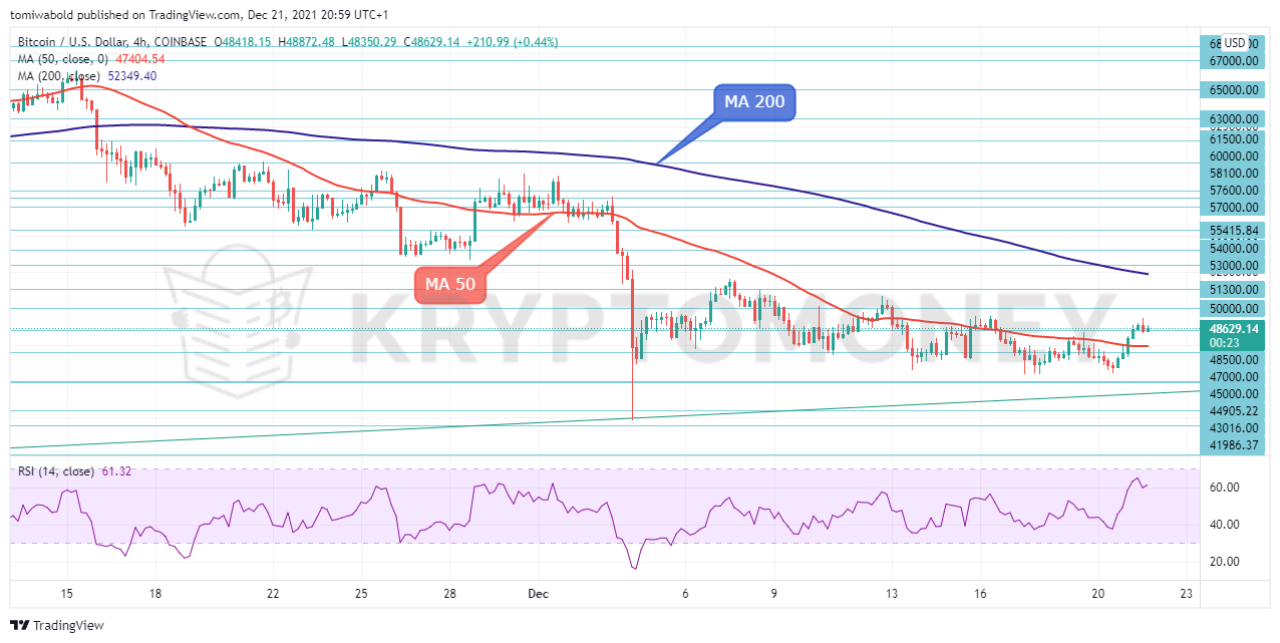 BTC/USD 4-Hour Chart
On the 4-hour chart, BTC/USD is looking indecisive in the short-term picture. A decisive step above $50,000 or below the short-term moving average (MA 50) at $47,500 could direct market sentiment accordingly. After the bounce, BTC/USD pair has met mild selling pressure near $49,339. A bearish MA 50 cross combined with a break below $47,000 might indicate weakness in the latest rebound.
An overbought RSI may cause a brief retracement, but the bulls may buy into weakness around $47,000. The $45,000 level is at the base of the initial rebound as support. A lack of bids could send the BTC towards this low region with the reversal attempt at stake. The following 3-4 sessions might be bullish for Bitcoin prices as the price holds well above the $45,000 level.
Note: Kryptomoney.com is not a financial advisor. Do your research before investing your funds in any financial asset or presented product or event. We are not responsible for your investing results
Image Credit: Shutterstock


Keep in mind that we may receive commissions when you click our links and make purchases. However, this does not impact our reviews and comparisons. We try our best to keep things fair and balanced, in order to help you make the best choice for you.
