
It’s a historic week for BTC as El Salvador adopted the lead crypto as its legal tender. The adoption may have aided Bitcoin’s price to hit about $53,000 on Monday, its highest level since May, but it also served as a precursor to a massive decline. After plunging nearly 20% in one of the largest selloffs since May, BTC was trading marginally higher from lows reached during the week, as stability returns around $45k. So far BTC/USD has held on to the moving average (MA 50) up from $42,830 lows reached on Tuesday. At the time of this post, the price of the lead crypto hovers at $45,544. Bitcoin futures open interest has been steadily increasing for months, hitting roughly $20 billion in early September. Analysts say it’s still below a peak of roughly $28 billion in April 2021, but it’s enough to trigger price action to spiral. This hardly, however, is preventing some bulls from forecasting higher prices, believing that BTC would be worth $120,000 in 2040, based on its decelerating supply compared to the expected rise of the M2 US dollar money supply.
Key Levels
Resistance Levels: $53,000, $50,000, $47,000
Support Levels: $43,000, $40,000, $37,500
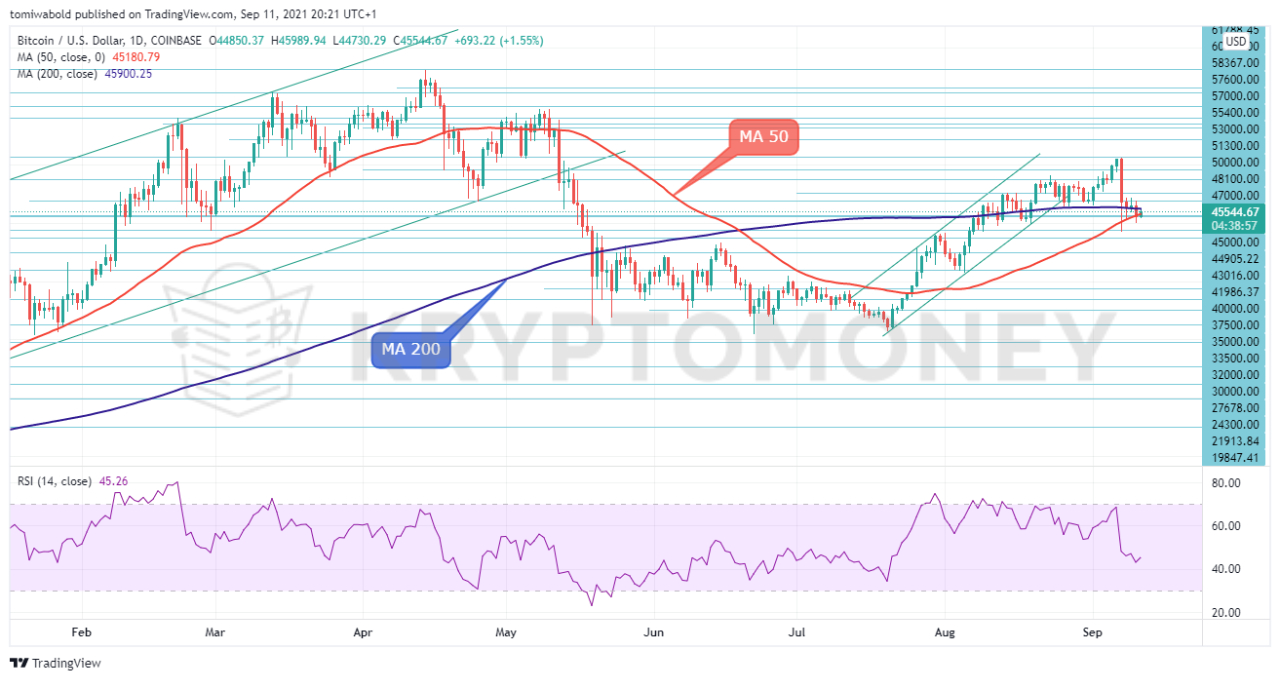 BTC/USD Daily Chart
Following a spectacular rise to the highs that saw BTC/USD touch $52,944 before losing steam, the lead crypto is confronted with a brief retracement. Amid the decline from its local high, it has experienced a setback on its way to establishing a bullish reversal past the $48,000 barrier. However, the converging moving averages (MA 50 and MA 200) may lead to a bigger rally in the medium term.
On the contrary, the relative strength index (RSI) on the daily chart has continued to decrease from overbought levels. However, to resume the relief rally beyond the $50,000 psychological zone, BTC buyers will need to defend support above the $43,000 breakout mark. Meanwhile, any such weakness beneath the $43,000 zone will empower the bears to reclaim the lower bound at $40,000.
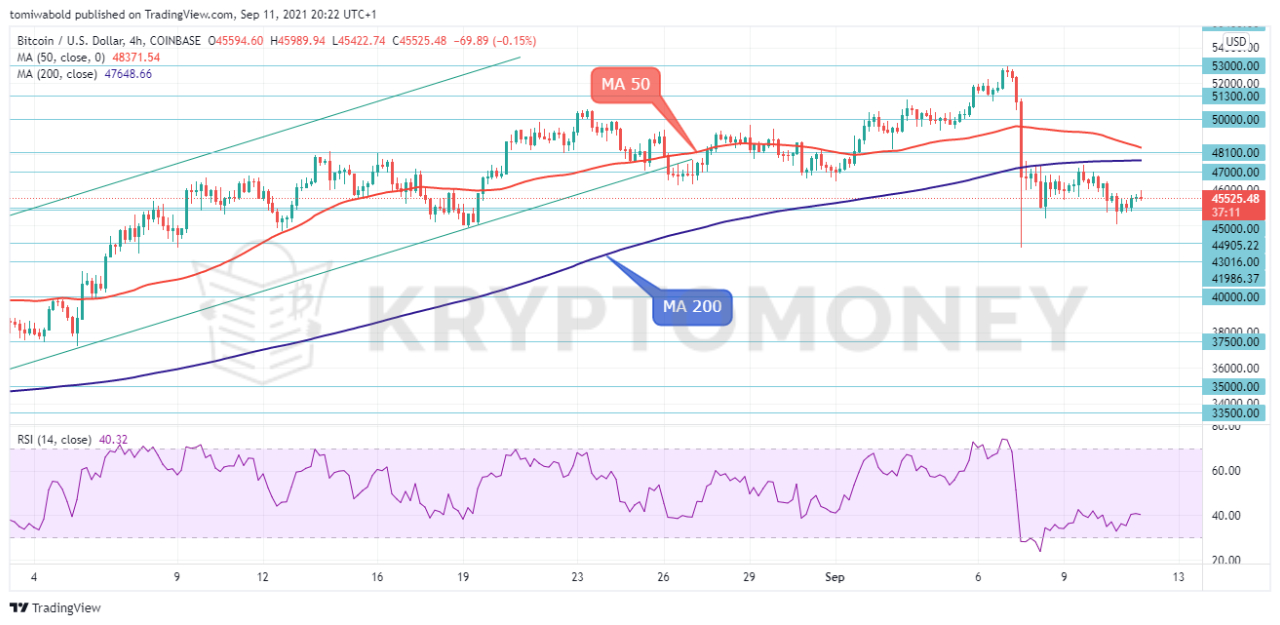 BTC/USD 4-Hour Chart
On the lower time frame as seen on the 4-hour chart, BTC/USD price has clung on to the $45,000 horizontal zone after Tuesday’s crash. The short-term frame shows its relative strength index (RSI) has rebounded from the low line reached recently. The $45,000 zone is projected to fill up buy orders towards the $48,000 level as fresh buyers line up on exchanges to buy the Bitcoin decline.
BTC is still clinging to the $45,000 level, hoping to establish it as a line of support rather than a point of resistance. If the price falls below this level, it might start its first downtrend since late July, however, a sustained slide from today’s closing below $45,000 would be required to reach a fresh lower bottom. If bulls sustain a price above $45,000, we might see the price return towards $50,000 in the next sessions.
Note: Kryptomoney.com is not a financial advisor. Do your research before investing your funds in any financial asset or presented product or event. We are not responsible for your investing results
Image Credit: Shutterstock


Keep in mind that we may receive commissions when you click our links and make purchases. However, this does not impact our reviews and comparisons. We try our best to keep things fair and balanced, in order to help you make the best choice for you.


