
Led by Bitcoin, the overall crypto market succumbed to downward pressures and moved sharply lower. After a failed attempt to overcome the resistance at $38,000, Bitcoin (BTC) downside correction began while taking the lead cryptocurrency to 10 days low. The impact created a sudden dip on BTC/USD as the price hits $30,800. BTC had plunged from a daily high of $35,628 to smash key support at $32,000 as seen on Coinbase. BTC has an available coin supply of 18.6 million, which is among the lowest-circulating supplies of all coins. The coin ranks no. 1 on the Coinmarketcap table, with a market cap of $593.92 billion with $68.99 billion in trade volume over the past 24 hours. The BTC/USD is currently trading at a price level of $31,890 and maybe poised for a stronger pullback below $30,000. Bitcoin (BTC) optimistic outlook is keenly contested amid US transfer of power & new stimulus package. The cryptocurrency market is at crossroads after the inauguration of President Biden as impulses indirectly point to the likelihood of large investors selling off their crypto assets.
*BTC had plunged from a daily high of $35,628 to smash key support at $32,000 as seen on Coinbase
*The impact created a sudden dip on BTC/USD as price hits $30,800
*Bitcoin (BTC) optimistic outlook is keenly contested amid US transfer of power & new stimulus package
Key Levels
Resistance Levels: $38,000, $35,000, $32,000
Support Levels: $30,000, $28,000, $26,000
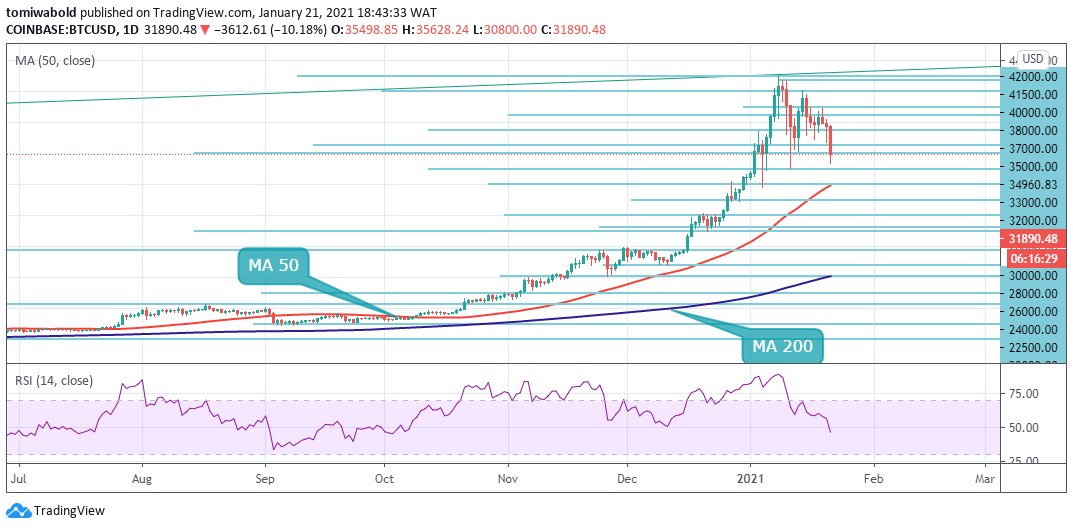 BTC/USD Daily Chart
BTC/USD has been trading inside a tightening range for 10 days without a clear direction. However, the bears have taken over and managed to push BTC price beneath the key $32,000 support level. The daily RSI has plunged beneath its midlines and is far from oversold levels. However, this could be a healthy correction of the recent bull rally that took Bitcoin above $40,000.
As we can see on the daily chart, BTC is losing the support of the medium-term bullish upside channel and is heading to a negative price segment of the chart close to the MA 50 at $28,000. Below the current price, the first support level is at $30,000, then the second at $28,000, and the third one at $26,000.
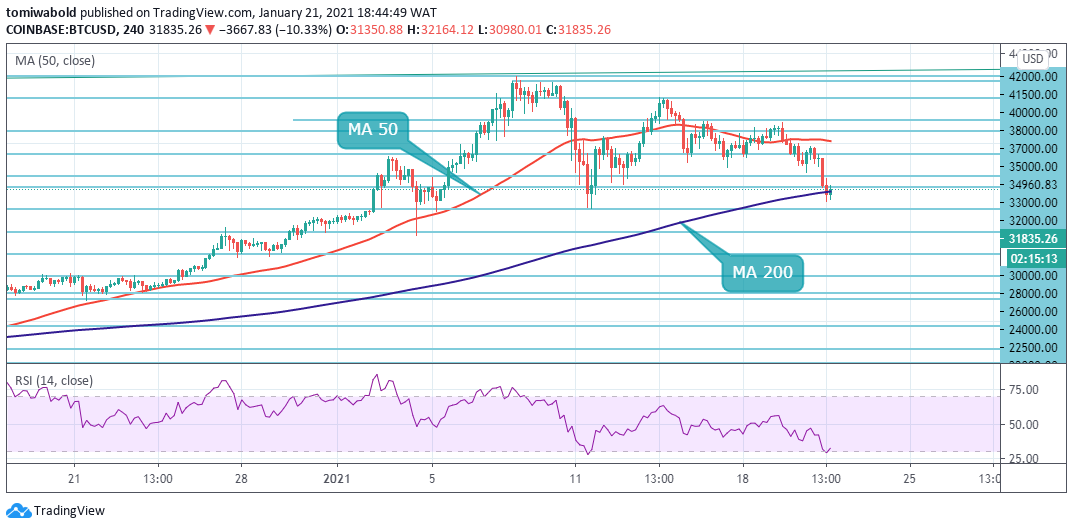 BTC/USD 4-Hour Chart
As observed on the lower time frame, BTC is once again under heavy selling pressure as the lead crypto continues to drift lower. The main focus for traders will be the $32,000 level following the loss of 4 hours MA 200. This area marks the bottom of a failed support zone. A break under this area could see the BTC/USD pair fall to the $30,000 and possibly the $28,000 support region.
To the upside, price stabilization past the $32,000 level should be considered a return to BTC bullish path. Traders that are bullish towards the BTC/USD pair may look to buy the dip at $32,000. The BTC/USD pair is only bullish while trading past the $35,000 level, key resistance is found at the $37,000 and the $38,000 levels. If the BTC/USD pair trades beneath the $35,000 level, sellers may test the $30,000 and $28,000 levels.
Note: Kryptomoney.com is not a financial advisor. Do your research before investing your funds in any financial asset or presented product or event. We are not responsible for your investing results
Image Credit: Shutterstock


Keep in mind that we may receive commissions when you click our links and make purchases. However, this does not impact our reviews and comparisons. We try our best to keep things fair and balanced, in order to help you make the best choice for you.
