
Bitcoin (BTC) the world’s largest cryptocurrency is up more than 11.50% this week alone. The upside move has positioned Bitcoin for the probability of a bullish wave and now seriously increasing. The Wednesday rally marks Bitcoin’s highest level since July 2019. After its recent upswing, BTC broke the 12k barrier on Tuesday without a retreat. The move saw yearly highs breached as BTC/USD sets fresh highs close to $13k marks. BTC has gone ahead to register an intraday high at $12,928 yet with increasing momentum. The Bitcoin (BTC) market cap is currently $236.47 billion, with $38.35 billion traded in the past 24 hours. The current spot price is up 7.5% in 24hrs while trading at $12,841. Paypal announces to offer Cryptocurrency and allow its users to buy, hold, and sell from their accounts starting in a few weeks. The move adds more fuel to BTC’s recent upswing. PayPal is one of the most popular global payment providers with more than 340 million active accounts.
*After its recent upswing BTC broke the 12k barrier on Tuesday without a retreat
*The move saw yearly highs breached as BTC/USD sets fresh highs close to $13k marks
*Paypal announces to offer Cryptocurrency and allow its users to buy, hold, and sell from their accounts starting in a few weeks
Key Levels
Resistance Levels: $15,000, $14,000, $13,000
Support Levels: $12,000, $11,500, $11,000
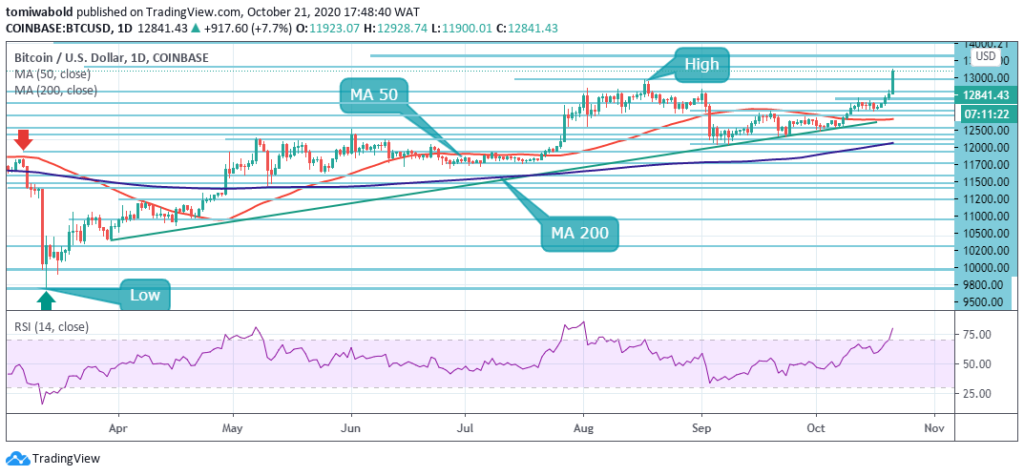 BTC/USD Daily Chart
The BTC/USD is on a path to test the $13,000 resistance fractal. This is the critical and key level for the bulls. A bullish breakout above the resistance fractal should spark a strong bullish rally that may spur a further wave to a journey back to $20,000 all-time high. As seen on the daily chart above, price action respected the support zone at $11,500 to charge beyond the $12,000 zone. Price has also broken above the resistance at $12,500.
On the support side, we have formidable support on approach to $11,700. This barrier is reinforced by a confluence of former highs on the daily chart, which means the bears will have a hard time pushing through. Once it is out of the way, the selling momentum may start snowballing with the next focus on $11,200. However, the pullback scenario may give the opportunity as the best course of action for buyers.
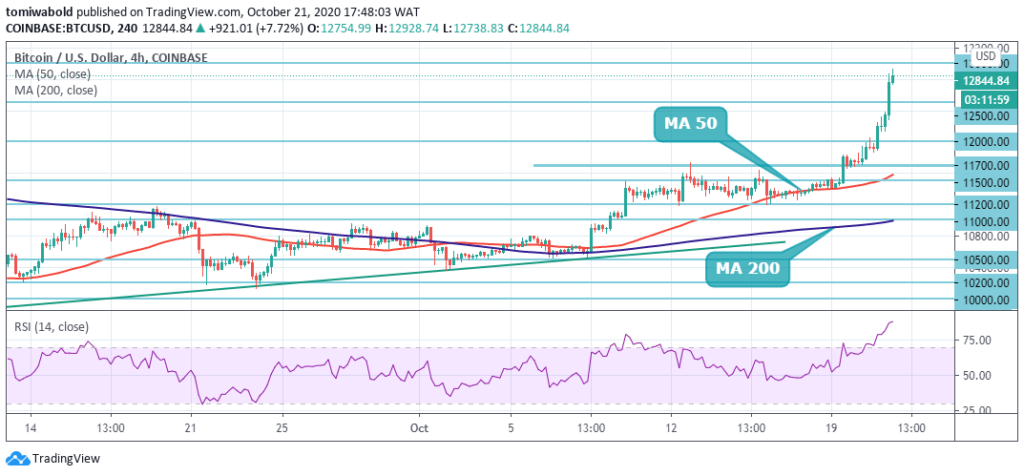 BTC/USD 4-Hour Chart
Bitcoin has rallied to trade at a fresh yearly high, with the pioneer cryptocurrency testing towards the $13,000 resistance level. BTC/USD bulls could now attempt to move the cryptocurrency above the $13,000 resistance level and set a new 2020 trading high. Traders should note that the short to medium-term goal for BTC/USD bulls could be the 2019 trading high, around the $13,900 resistance level.
However, If the bulls fail to keep up the pace and let BTC return below $11,700, new highs will have to wait at least until the price retests $10,500. The BTC/USD pair is only bullish while trading above the $12,000 level, key resistance is found at the $13,000 and the $14,000 levels. If the BTC/USD pair trades below the $12,000 level, sellers may test the $11,700 and $11,200 levels.
Note: Kryptomoney.com is not a financial advisor. Do your research before investing your funds in any financial asset or presented product or event. We are not responsible for your investing results
Image Credit: Shutterstock


Keep in mind that we may receive commissions when you click our links and make purchases. However, this does not impact our reviews and comparisons. We try our best to keep things fair and balanced, in order to help you make the best choice for you.
