The cryptocurrency market is witnessing a short-term pullback as bulls take profit. Bitcoin Gold is one of few digital assets in green, reaching highs of $62.45 in today’s trading session. At the time of writing, Bitcoin Gold (BTG) was exchanging hands at $55.07, up 10.03% in the last 24 hours and 18.77% weekly, with a present market valuation of $991 million. After a bullish ride in the prior week, Bitcoin has cooled off slightly by dipping below $40k while most Altcoins have also retraced. According to the Crypto Fear & Greed Index, which takes multiple factors into account when gauging sentiment across crypto markets, the dip has flushed out “greed.” On Monday, the Index stood at 48/100 — “neutral” territory — versus 60, or “greed,” on Sunday.
Key Levels
Resistance Levels: $122, $99.46, $67.00
Support levels: $44.69, $35.05, $20.62
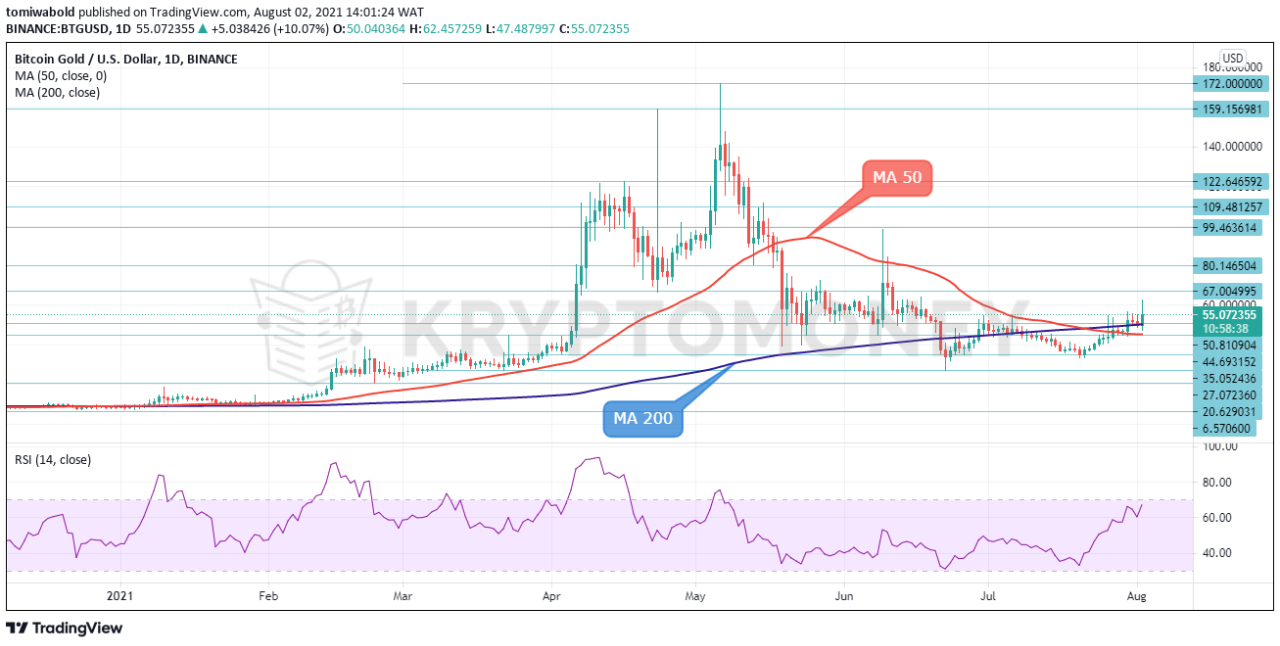 BTG/USD Daily Chart
Bitcoin Gold started a positive climb from lows of $33.72 on July 21, crossing above its daily MA 50 ($45.13) and MA 200 at $50.15 to touch the $62.45 level. Taken from today’s lows of $47.86, BTG rallied nearly 30% before paring slight intraday gains. Short-term momentum indicators are endorsing the recent positive move with the RSI climbing in bullish territory.
If the bulls stay in control, the next obstacle after $62.45 is $98.33. If buyers pierce above it, that would reaffirm the positive picture, paving the way for a test of $122.67 level ahead of the yearly high at $172.06. On the flip side, a potential pullback could stall initially near the MA 200 before approaching the MA 50, currently at $45.13. A bearish break below here may open the door for a test of the $27.11- $33.72 support range.
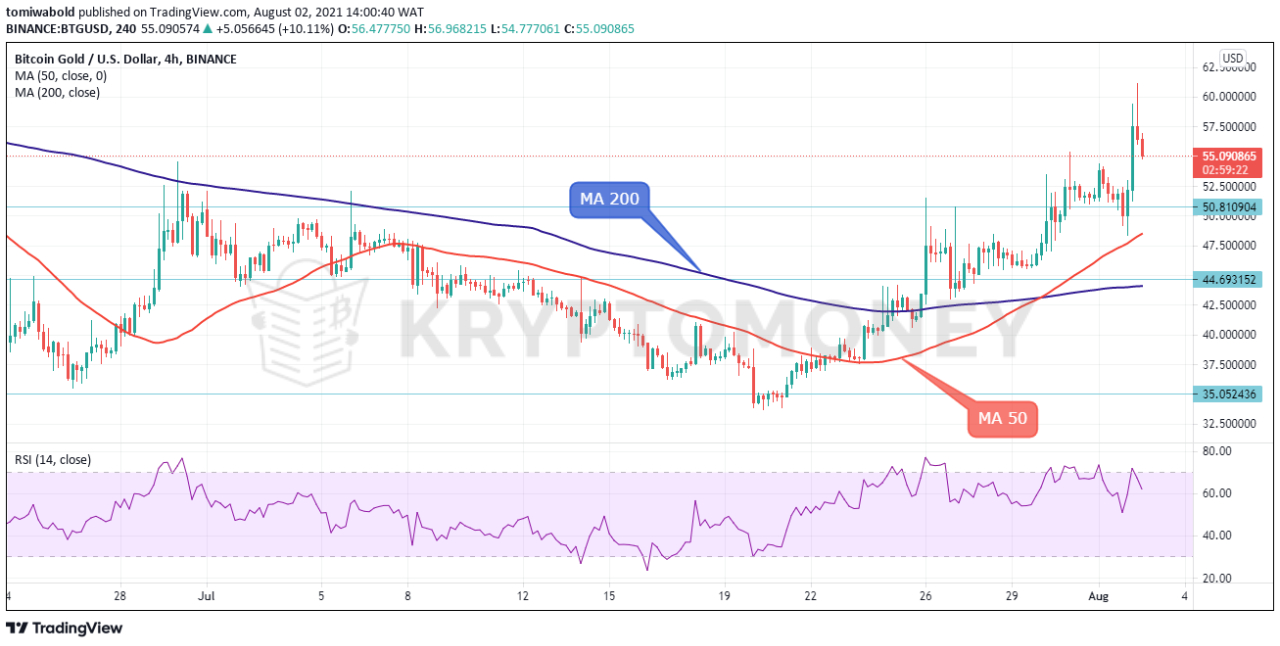 BTG/USD 4-Hour Chart
Bitcoin Gold’s upside correction overcame the moving averages following a rebound on the base of $33.69 on July 21. Despite the RSI moving in bullish territory, the technical oscillator has slowed down recently, suggesting that the rally may take a breather. The implied decreasing positive momentum in the price is drawing some caution as bullish crosses have occurred between the 4-hour MA 50 and MA 200. If buying interest is sustained beyond the $62.45 barrier, the bulls could then move to test the $98.22 and $122.67 obstacles ahead of the yearly high at $172.06.
Alternatively, if the bears manage to pull the price back below the $55.41 barrier now turned support, the price could initially stall at the MA 50 at $48.48 before testing the MA 200 at $44.08. Lower, if the $37.58 support gives way, traders could shift focus towards the $36.37 level ahead of the floor of lows at $33.69. All in all, BTG/USD remains well bid above the bullish crossover of the 4 hour MA 50 and 200.
Note: Kryptomoney.com is not a financial advisor. Do your research before investing your funds in any financial asset or presented product or event. We are not responsible for your investing results
Image Credit: Shutterstock


Keep in mind that we may receive commissions when you click our links and make purchases. However, this does not impact our reviews and comparisons. We try our best to keep things fair and balanced, in order to help you make the best choice for you.
