Highlights
The cryptomarket is nursing wounds after a carnage struck in the earlier part of the day. Bitcoin Gold, a hard fork of the original Bitcoin remains one of the day’s performers. From today’s low at $67, breakout on BTG/USD ensues to new yearly highs of $159.15. After paring some intraday gains, BTG presently trades at $83.77 but remains up by 12.87% on the day. Still, within the top 100 categories, Bitcoin Gold’s market valuation stands at $1.36 billion with a 24-hour trading volume of $408 million. Bitcoin and Altcoins (except some select few) are in the red as the market plunged in a move alluded to U.S. President Joe Biden’s proposed tax hike for capital gain. Bitcoin Gold is however seen withstanding the market selling pressure. BTG breakout comes after Binance announced trading support for a number of BTG pairs in the previous week.
Key Levels
Resistance Levels: $160, $140, $122
Support levels: $67, $50, $35
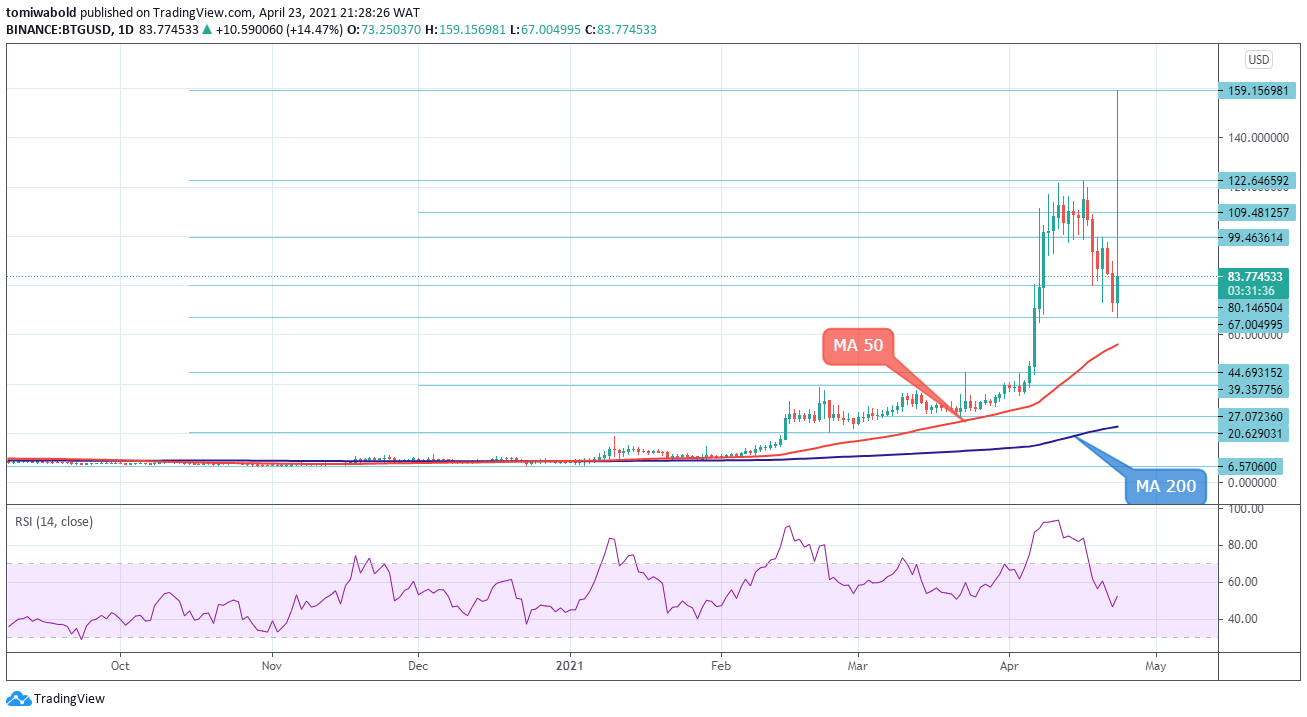 BTG/USD Daily Chart
Bitcoin Gold (BTG) came under significant downside pressure in the prior week. BTG trimmed its bullish streak after reaching highs of $122, causing it to dive back to intraday lows of $67. BTG shifted into a higher gear after hitting support at this level, simultaneously thrusting above the $100 psychological level and the previous yearly high of $122. If the BTG/USD pair’s recently acquired confidence manages to overcome the $159 barrier, a neutral-to-bullish outlook could be seen developing on the short-term timeframe with the daily RSI set to stretch above its 50 neutral marks.
Beyond the $159 high, the door would open for the key resistance of $180 – $200. On the other hand, if the price recoils below the current levels, a vital support zone could develop from today’s low at $67. Should the price happen to plunge past this level, the BTG/USD pair may sink towards the MA 50 at $56 before extending losses to the $50 and $44 levels.
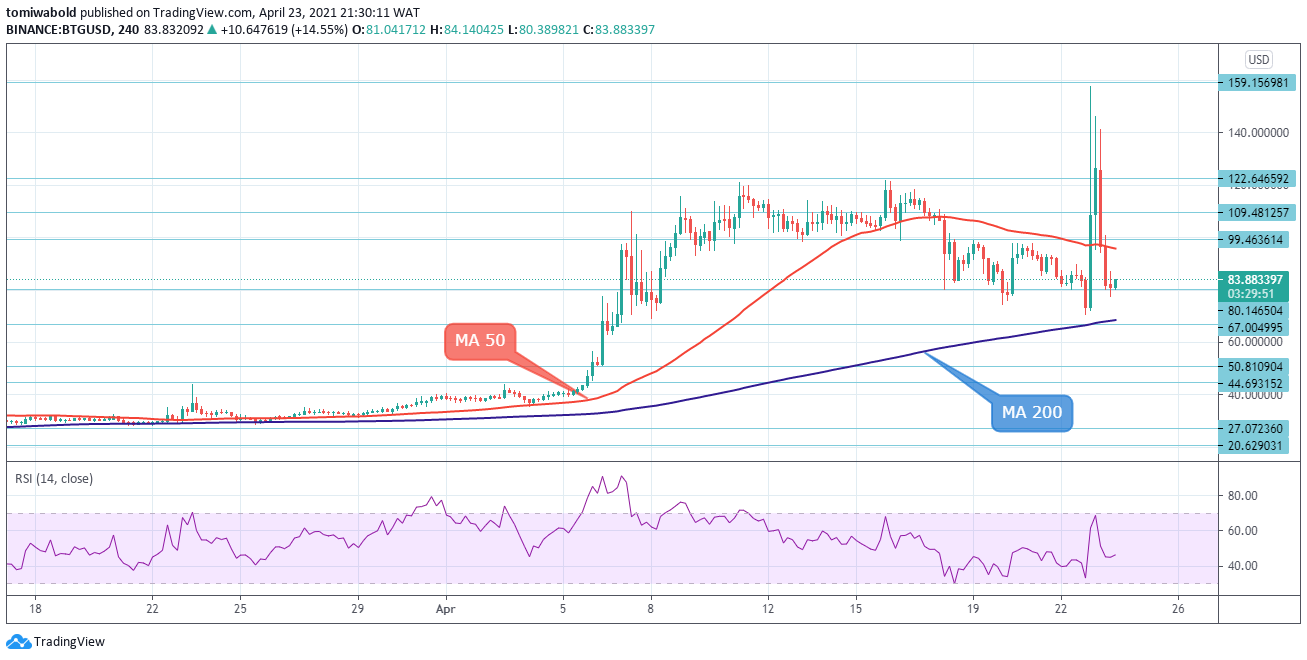 BTG/USD 4-Hour Chart
BTG/USD’s upsurge encountered resistance above the $159 level. This caused BTG to decline and reach the $77 support below the previously passed MA 50 ($96). In the case of the BTG/USD breaking below the $77 level, the pair could once again find support in the $70 level, which previously reversed a decline. Extending losses past this safety level, the price could challenge the MA 200 at $68 before meeting the $50 support.
The momentum indicators seem to be leaning to the bearish side as the RSI hovers below the 50 neutral marks. BTG/USD might consolidate below the MA 50 before the next major breakout. If the $77 support holds, BTG/USD could face various resistance levels from the MA 50 ($96) up to the $159 levels. Should buyers overrun these tough obstacles, the pair could jump to see the $200 and $250.
Note: Kryptomoney.com is not a financial advisor. Do your research before investing your funds in any financial asset or presented product or event. We are not responsible for your investing results
Image Credit: Shutterstock


Keep in mind that we may receive commissions when you click our links and make purchases. However, this does not impact our reviews and comparisons. We try our best to keep things fair and balanced, in order to help you make the best choice for you.