
The cryptocurrency market is yet to give any clue as regarding directional momentum, BTC dipped to lows of $53,966. BitTorrent (BTT) is edging higher to post double-digit gains despite market uncertainty. Bittorent entered into consolidation shortly after attaining highs of $0.0040 on Mar. 20. This consolidation became strong enough to cancel the bearish wave across the market. On Mar. 27, BTT/USD pushes to new all-time highs at $0.0040. BitTorrent’s BTT token has gained 12.51% in the last 24 hours and 15.92% weekly. At a present price of $0.0038, BitTorrent has gained nearly 2,000% since Dec. 2020. BitTorrent has a present market valuation of $3.83 billion with a circulating supply of nearly 989 billion tokens. BitTorrent (BTT) is utilized for file sharing and also to pay for decentralized storage services. Decentralized data storage is gaining ground at the moment due to NFTs mania. NFT buyers are paying a huge amount in dollars to buy NFTs of their choice. If the NFT is lost due to any reason, it will incur a huge loss to the buyer. This is where decentralized storage comes in for NFTs.
*Bittorent entered into consolidation shortly after attaining highs of $0.004 on Mar. 20
*At a present price of $0.0039, Bittorrent has gained nearly 2000% since Dec. 2020
*BitTorrent (BTT) is utilized for file sharing and also to pay for decentralized storage services
Key Levels
Resistance Levels: $0.0060, $0.0050, $0.0040
Support Levels: $0.0037, $0.0032, $0.0029
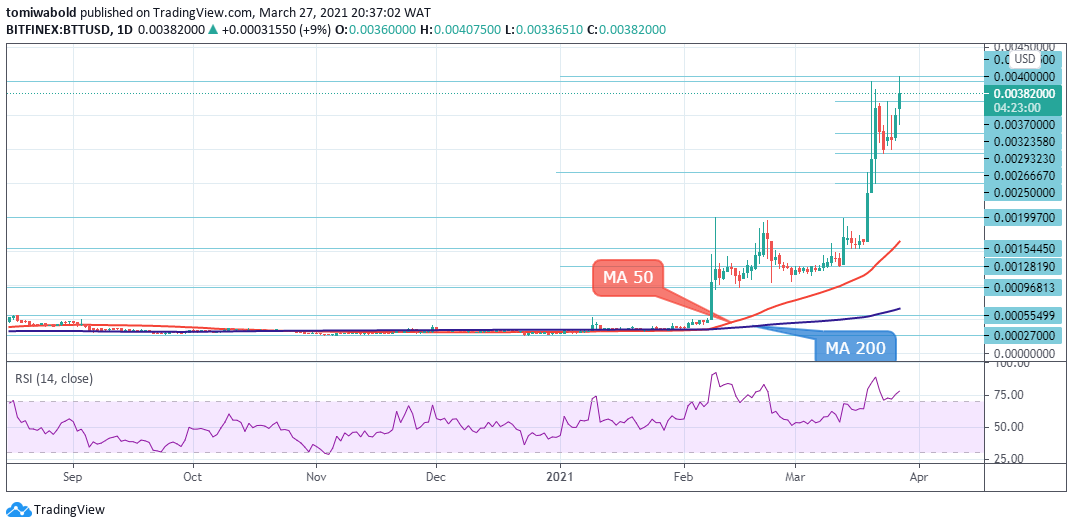 BTT/USD Daily Chart
BitTorrent’s price consolidation from Mar. 21 allowed buyers to take positions and regain control over the price. BitTorrent just hit its all-time high at $0.0040 which means it’s facing practically no resistance above. If the bulls can sustain a push past all-time highs at $0.0040, the BTT/USD pair may climb to $0.0050.
The bears are likely to pose a stiff challenge at the $0.0040 level and then try to sink the price below the $0.0029 support. If they can pull it off, the BTT/USD pair could extend its decline to the MA 50 at $0.0016. The rising moving averages and the RSI in the overbought zone suggest the path of least resistance is to the upside.
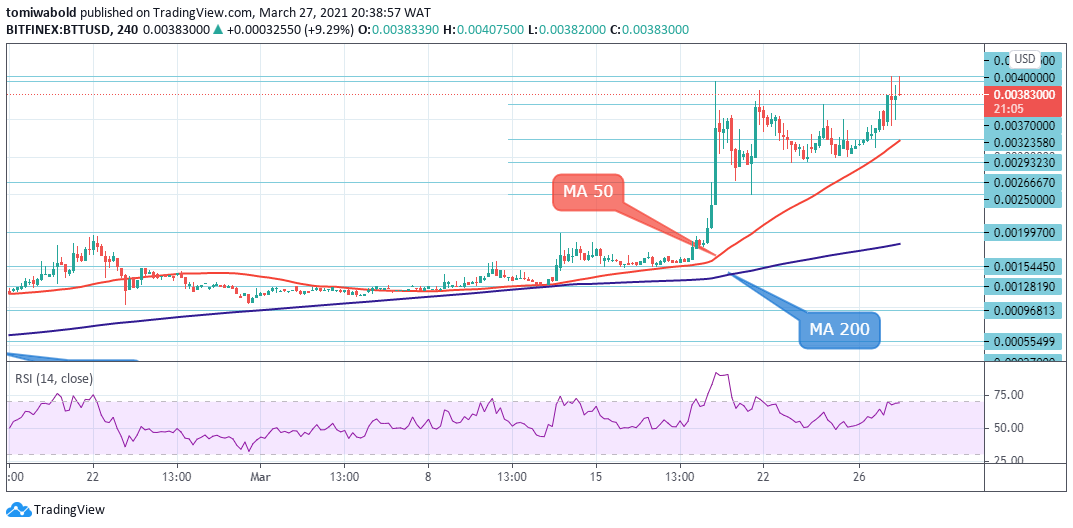 BTT/USD 4-Hour Chart
On the 4-hour chart, BTT price has been able to steadily climb above $0.0037 which served as the upper part of the range. If bulls can thrust the price above the recent high at $0.0040, the BTT/USD pair could start the next leg of the uptrend that may reach $0.005 and then $0.006. BTT/USD bulls may attempt to test back towards the channel once again.
Conversely, if the bears successfully defend the overhead resistance above $0.0040, the pair may consolidate in a range between $0.0026 and $0.0036 before the bulls continue. A bullish continuation would imply a retest of resistances above $0.0037 and $0.0040. If selling pressure intensifies, a break below the MA 50 at $0.0032 could extend the decline to $0.0025 (Mar. 21 low).
Note: Kryptomoney.com is not a financial advisor. Do your research before investing your funds in any financial asset or presented product or event. We are not responsible for your investing results
Image Credit: Shutterstock


Keep in mind that we may receive commissions when you click our links and make purchases. However, this does not impact our reviews and comparisons. We try our best to keep things fair and balanced, in order to help you make the best choice for you.