
Highlights
The cryptocurrency market is yet to fully recover from Sunday’s massive drop. Selected tokens are showing signs of mild recovery such as Chiliz. Chiliz (CHZ) remains in consolidation after hitting all-time highs at $0.97 on Mar. 13. An attempt to break out of the range on Apr. 16 met resistance at $0.86, causing declines to subsequent lows of $0.44. At the time of writing, Chiliz is continuing its rebound from lows of $0.44, up by 7.53% on a 7-day basis. While trading at $0.546, CHZ is up 6.48% on the day. Still, within the top 50, Chiliz has a present market cap of $2.95 billion and $1.41 billion in trade volume over the last 24 hours. In Feb. 2020, FC Barcelona announced a global partnership with Chiliz blockchain for BAR tokens. The FC Barcelona Fan Token (BAR), a utility token that gives its fans a tokenized share of influence on club decisions went live on Binance on April 21st.
Key Levels
Resistance Levels: $0.9760, $0.8074, $0.6720
Support Levels: $0.4900, $0.4222, $3669
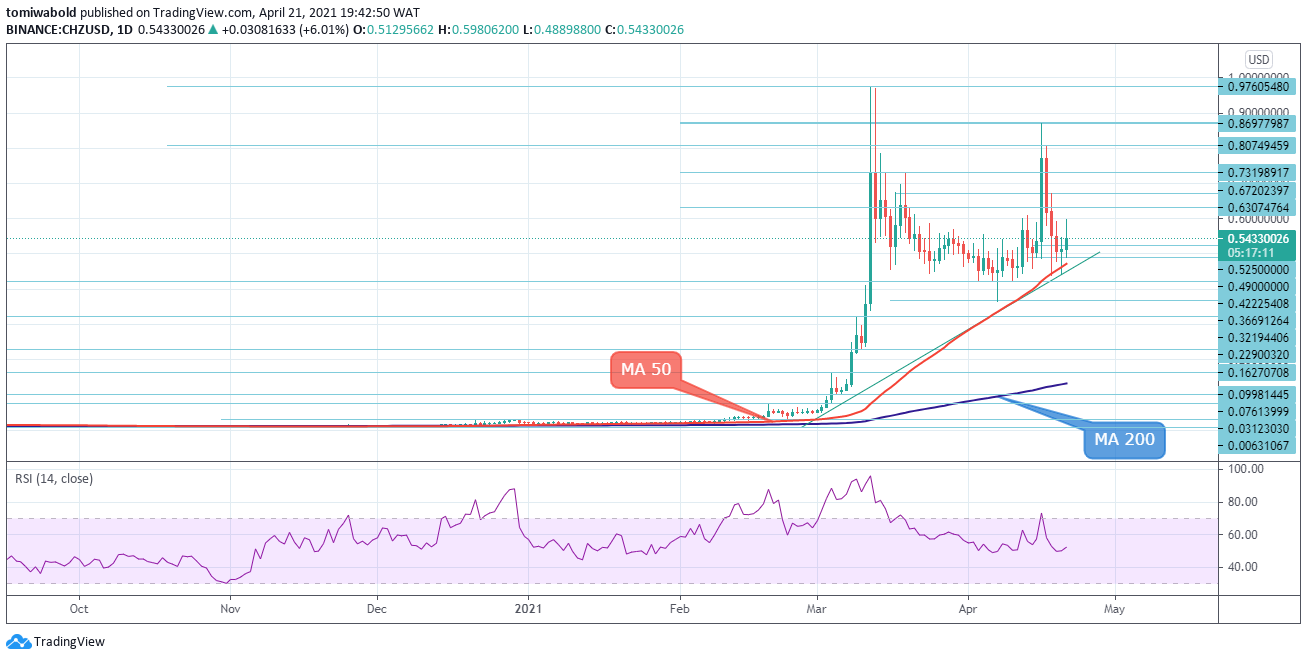 CHZ/USD Daily Chart
CHZ/USD is continuing its attempts to break out from the resistance area from above where it trades presently to around $0.86. After massive declines over the weekend, Chiliz price action closed somewhat flat, resulting in a Doji close on Monday. Though signaling indecision, the Doji pattern could see to a possible bullish reversal in the coming sessions. However, the sentiment remains mixed for the moment. A strong bullish close above $0.60 could see CHZ rising above $0.67 to reach resistance targets at $0.72 and $0.86.
This will open the way forward for CHZ/USD to retest the Mar. 13 all-time highs of $0.97. Alternatively, if CHZ price turns down from current levels, there could be a likely move back toward the ascending trendline support of $0.44. CHZ may consolidate for a few more days before the next major move. The flattened RSI at mid 50 reading suggests possible sideways trading could be anticipated.
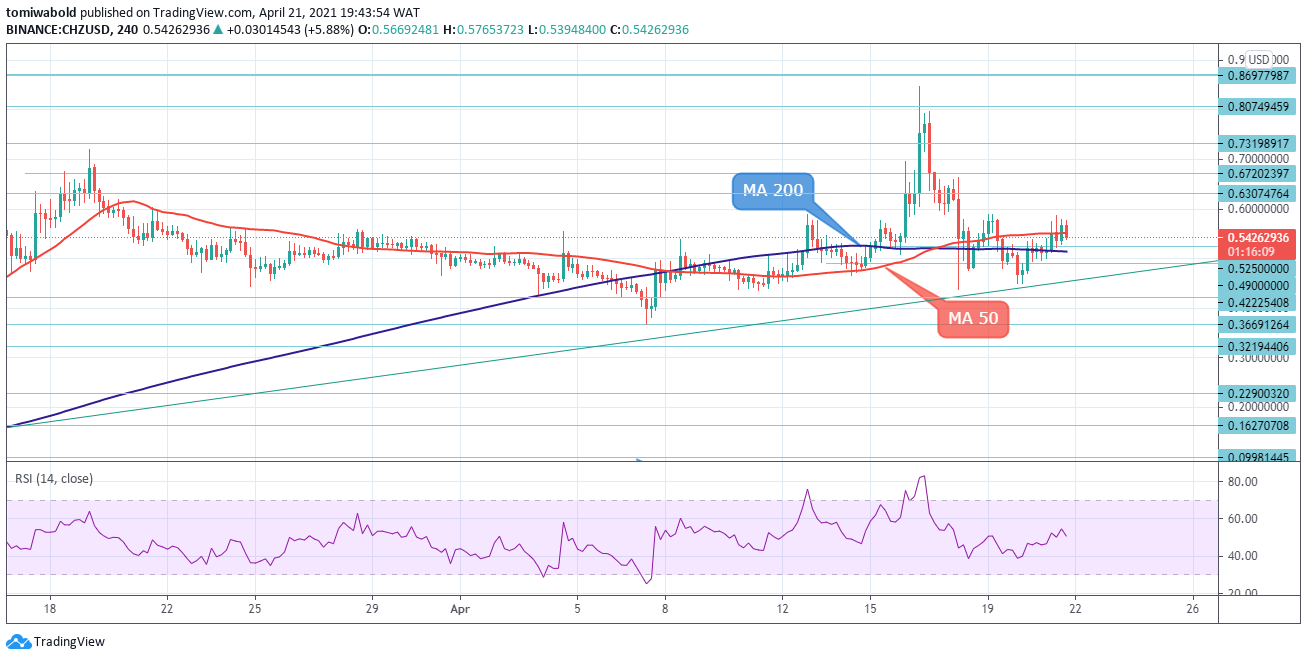 CHZ/USD 4-Hour Chart
In the aftermath of a failed attempt to break above the $0.86 resistance on April 16, the CHZ/USD declined to the support of the $0.43 level. Afterward, the pair recovered to start trading sideways constricted by the 4-hour moving averages 50 and 200. Technical studies send mixed signals as a cluster of MA’s in bearish setup weighs, while the flattened RSI hovers slightly above the mid 50 reading. CHZ needs a clear break above the MA 50 ($0.55) barrier to signal the continuation of the recovery phase from the ascending trendline low of $0.45.
Breach of either MA 200 support ($0.51) at the downside and MA 50 ($0.55) at the upside would generate an initial direction signal. The ranging scenario would look for confirmation on the lift above $0.6307, while further negative signal could be expected on extension below $0.5250 beneath MA 200. There is also an ascending triangle pattern emerging near the resistance area. A successful upside breakout puts the near-term target toward the 16th April highs, if not closer.
Note: Kryptomoney.com is not a financial advisor. Do your research before investing your funds in any financial asset or presented product or event. We are not responsible for your investing results
Image Credit: Pixabay


Keep in mind that we may receive commissions when you click our links and make purchases. However, this does not impact our reviews and comparisons. We try our best to keep things fair and balanced, in order to help you make the best choice for you.
