DigiByte is a decentralized blockchain solution providing fast, secure payments to users. It is specifically ranked on Coinmarketcap as no.36. DGB has been in a bullish run since March although after peaking at $0.0267 on May 6, it recorded a minor correction. DigiByte is exchanging at $0.0212 at the time of this article. Its current supply in circulation is 13,272,297,845 DGB with a market cap of $283,681,306. Bulls have propelled price past $0.0240 on DGB/USD in the last 24 hours, but no consistent break has so far been identified. The token recorded an intraday high of $0.0244 from its known $0.0160 support after a rebound of nearly 35%. Binance reveals DigiByte (DGB) listing on its platform on Monday, June 22, after the DGB recorded a considerable rise in its trading volume that triggered a huge bull shift. Users can initially trade three pairs; DGB/BNB, DGB/BTC, and DGB/USD. The DGB listing fee is zero BNB, to further support the asset.
*Bulls have propelled price past $0.0240 on DGB/USD in the last 24 hours, but no consistent break has so far been identified
*The token recorded an intraday high of $0.0244 from its known $0.0160 support after a rebound of nearly 35%
*Binance reveals DigiByte (DGB) listing on its platform on Monday, June 22, after the DGB recorded a considerable rise in its trading volume that triggered a huge bull shift
Key Levels
Resistance levels: $0.0295, $0.0267, $0.0240
Support Levels: $0.0205, $0.0188, $0.0160
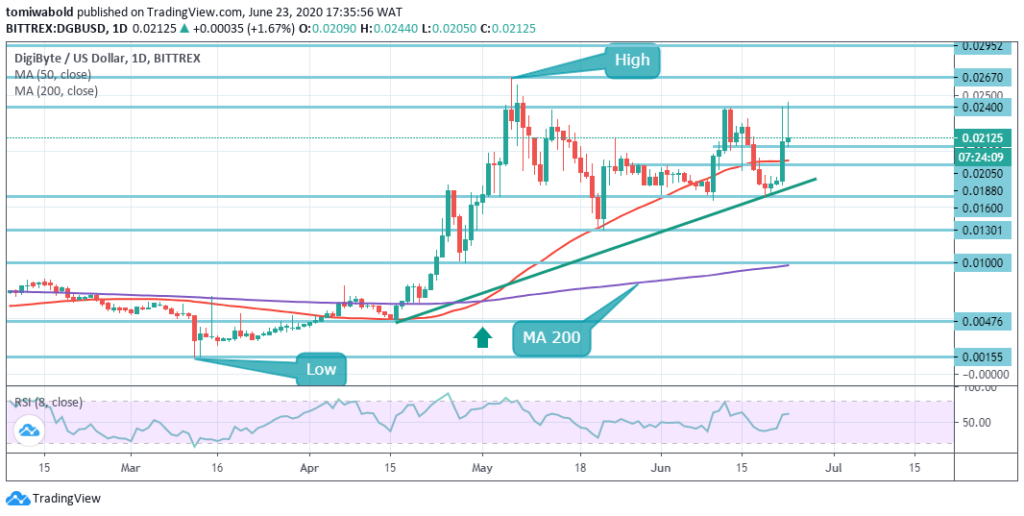
 DGB/USD Daily Chart
Bulls propel DGB from $0.019 beyond the daily MA 50 after beginning a rebound from its ascending trendline support at $0.016. Interestingly, the RSI is just at 60 marks and its upside move is not overbought yet. DGB stepped back from the $0.0244 high but regained and is trading at $0.0212 at the moment.
On the negative side, if the support can not hold at $0.0188 and a lower price break occurs beneath the MA 50, there may be a change in the trend where Digibyte could attempt to cross its known support at $0.0160. The surge up is steady past the $0.0240 resistance and the next probable goal is May 6 high at $0.0267. This resistance prevents the asset from a more optimistic run to the ultimate target beyond its 2020 highs.
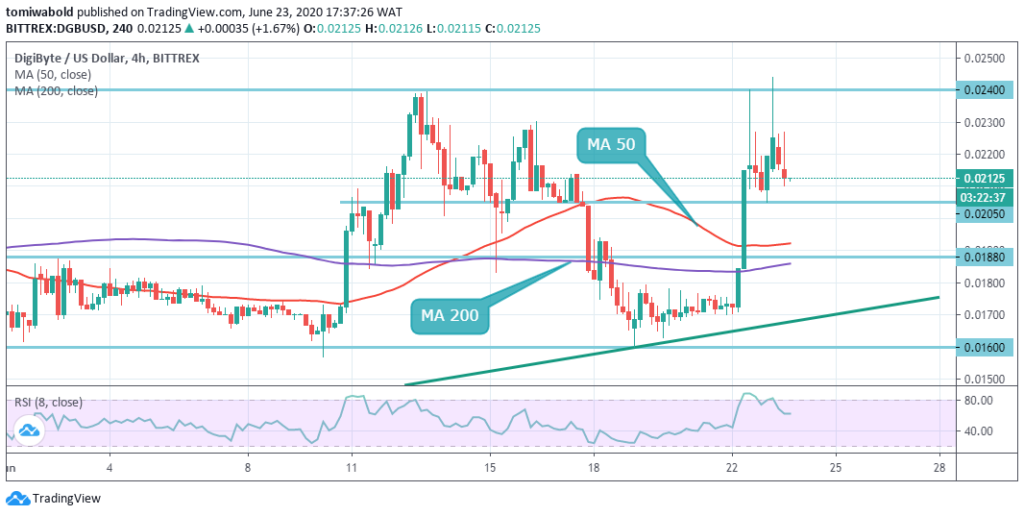
 DGB/USD 4-Hour Chart
Digibyte has stepped back to the price convergence zone around $0.0205 in the near term on the 4-hour time frame after the cryptocurrency met high technical resistance from the $0.0240 range. Technical analysis suggests that the DGB/USD pair ranges with a marginal bullish bias in the short term while price trades beyond the $0.0188 minor support level.
Buyers should consider that a breakout beyond the level of $0.0240 reinforces more upwards toward the level of $0.0267. The DGB/USD pair is bullish while exchanging beyond the level of $0.0188, key resistance is discovered at the $0.0240 and the $0.0267 levels. Once the DGB/USD pair exchanges beneath the $0.0205 level, sellers may test support levels of $0.0188 and $0.0160.
Note: Kryptomoney.com is not a financial advisor. Do your research before investing your funds in any financial asset or presented product or event. We are not responsible for your investing results
Image Credit: Shutterstock
Keep in mind that we may receive commissions when you click our links and make purchases. However, this does not impact our reviews and comparisons. We try our best to keep things fair and balanced, in order to help you make the best choice for you.