
On March 12th, top crypto asset by market capitalization, Bitcoin wobbled greatly, flunking around its support to hit a low of $3,800 in the biggest selloff it had ever recorded, even in years.
Subsequently, many analysts had called in $3,800 as its bottom, but while the coronavirus pandemic raged on, coupled with a bearish equities market led some to believe Bitcoin may plunge further beneath the supposed $3,800 bottom while inferring that this may not be the actual bottom though.
The idea of bottoming is crucial as it indicates the lowest point at which a potential rally is possible. Most bottoms can be a signal for a trend reversal.
Bitcoin has been a firm guide for the rest of the crypto market, of recent, Altcoins have posted correlatable trends with Bitcoin, so calling in Bitcoin bottom may also infer that the crypto market has bottomed too.
Bitcoin over the last week has performed remarkably well, surging from the $6,100 price recorded last Sunday to a weekly high of $7,300, while outperforming most cryptocurrencies.
1. Bitcoin Hash Ribbon Goes Bullish- Hash Ribbon which is often deduced from the moving averages of Hash Rates. BTC Hash rate refers to the computing power which miners put into validating the Bitcoin blockchain.
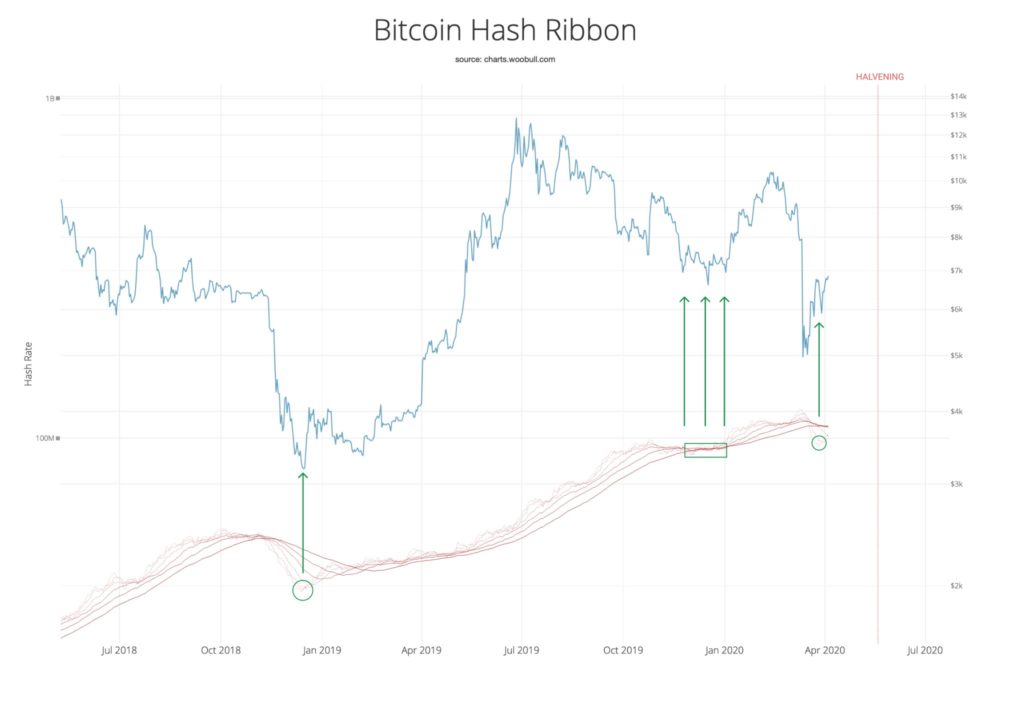 Analysts have touted this to be a proven bottom indicator as bullish Hash Ribbons were seen on two historical counts. First in December 2018, when BTC hit $3,150 bottom and of recent, December 2019 when BTC hit $6,400 bottom.
2. Miners Energy Ratio Enters Buy Regions- The Miners Energy Ratio refers to the comparative measure between the Bitcoin market cap and its energy usage. Before the last halving which saw Bitcoin rise exponentially by 4000% to a high of $20,000 subsequently, Miners Energy Ratio was seen to enter the overbought zone.
3. Bitcoin Buy Orders Outweigh Sell Orders- A trader Nik Patel shared screenshots of licensed cryptocurrency retail brokerages located in the U.K, this revealed that most of the users are long on Bitcoin. This was also corroborated by IG.com indicating that 78% of its user accounts are long on Bitcoin.
The fact that Bitcoin buy orders out-weigh its sell orders is seen in Coinbase Pro’s order book, while only about 24,000 BTC in order prices down to $2,000 and instead just 4,000 BTC in order prices up to $12,000.
4. Historical Antecedents As Bitcoin’s Price Activity Correlates With Past Trends- Based on two historical counts, first in December 2018 and early 2019, a renowned Trader, Coiner-Yadox has drawn a similitude between BTC’s recent price activity to these two. At these two significant times, Bitcoin was noted to have bottomed its chart.
The charts in December 2018 and early 2019 depicted a plunge into a bottom, immediate recovery from the bottom, then triangular break out upwards.
Bitcoin’s price activity of recent showed that it is yet to rally out of the triangle in a manner seen in early 2019. If Bitcoin follows this historical trend to the letters as to form a fractal T, a price breakout beyond $8,000 may be seen in the upcoming time.
Image Credit: charts.woobull.com, Shutterstock


Keep in mind that we may receive commissions when you click our links and make purchases. However, this does not impact our reviews and comparisons. We try our best to keep things fair and balanced, in order to help you make the best choice for you.
