
The cryptocurrency market is trading back in green following profit takings in the earlier part of the week. The majority of Altcoins are presently posting a rebound and Dogecoin (DOGE) is no exception. At the time of writing, DOGE was exchanging hands at $0.2010, up 2.15% in the last 24 hours. Ranking 8th largest, Dogecoin’s present market capitalization sits at $26.28 billion while having $1.04 billion in traded volume over 24 hours. German brand Philipp Plein has confirmed that it will become the first major luxury fashion group to accept payment in cryptocurrency. Payments in digital currencies (15 different cryptocurrencies, Dogecoin inclusive) will now be accepted both for purchases made in retail stores and on the group’s e-commerce platforms.
Key Levels
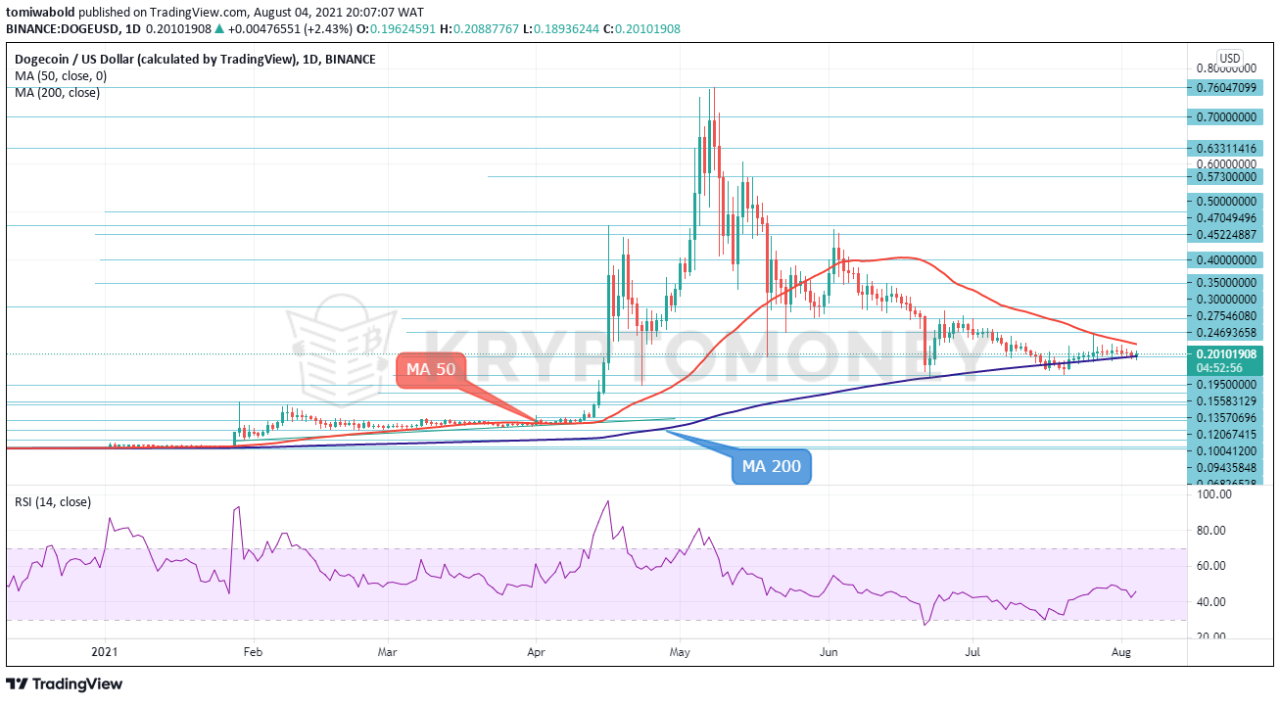
Resistance levels: $0.3500, $0.3000, $0.2469
Support Levels: $0.1593, $0.1357, $0.1004
 DOGE/USD Daily Chart
The DOGE/USD pair attempted to break past the $0.242 level on July 26 but has retreated into the triangular range. This is forming inside a larger wedge pattern, defined by the moving averages and the $0.46 June 2nd high. A breakout past the MA 50 at $0.221 would target the $0.242 high, followed by the $0.34-$0.36 range and the $0.46 level. Above this area, resistance levels come in at $0.60 and $0.76 May all-time highs.
The narrowing distance between the moving averages is a key item to watch as the RSI attempts to rebound towards the 50 neutral marks. Alternatively, a move lower could occur, with the MA 200 at $0.195 taken out, and the $0.159 tested, possibly offering the chance for a retest of the wedge bottom. A wedge is a price pattern marked by converging trend lines on a price chart usually considered as useful indicators of a potential reversal either bullish or bearish.
 DOGE/USD 4-Hour Chart
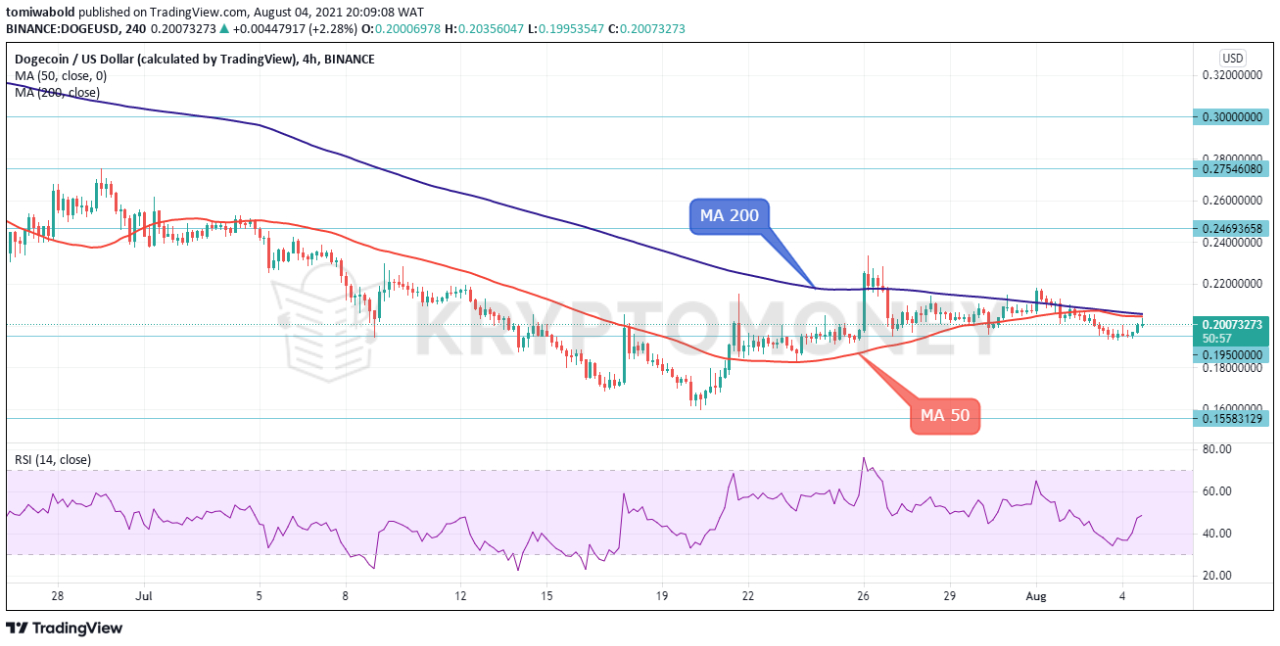
On the 4-Hour Chart, DOGE/USD managed to tick above the MA 200 at $0.2055 on August 1st but the bulls were soon rejected around $0.21, with the price declining to hit fresh lows near $0.193 on August 3rd. A slight rebound ensued pushing the RSI beyond the 30 oversold levels. While the RSI is trying to return towards its 50 neutral marks, the moving averages are drawing closer together and are adopting a more horizontal bearing.
This is endorsing a neutral tone in the dog-themed token as buyers could come back in play to retest the $0.21 barrier if the price manages to rebound back above the moving averages of 50 and 200. If efforts prove successful this time, the way could open towards the $0.26-$0.30 area. Alternatively, sellers could dominate with nearby support forming at the $0.195 support. A sharp decline beneath here could confirm more losses ahead, shifting attention towards the $0.183 and $0.159 support levels.
Note: Kryptomoney.com is not a financial advisor. Do your research before investing your funds in any financial asset or presented product or event. We are not responsible for your investing results
Image Credit: Shutterstock


Keep in mind that we may receive commissions when you click our links and make purchases. However, this does not impact our reviews and comparisons. We try our best to keep things fair and balanced, in order to help you make the best choice for you.
