The cryptocurrency market is set to celebrate the New Year with new highs. BTC set a new all-time high at $29,321 before retreating. Polkadot (DOT) surpassed its previous all-time high of $7 and climbed above the next resistance of $8. On December 31, DOT went ahead to set fresh highs of $8.56. At its present price of $8.48, DOT has gained 14.88% on the day and 59.76% on a 7-day basis. The market cap is ranked 6th on the Coinmarketcap table with the current market capitalization of $7.3 billion. Breakout on DOT/USD to highs of $8.56 began on December 28 after Binance Home Page Listing & $10M Endorsement. At the time of writing, Polkadot is exchanging hands at $8.33, after registering an intraday high at $8.56. Binance recently announced a $10 million fund to support projects on Polkadot. DOT rallied on Dec. 28 after Twitter users noticed the ETH/BUSD pair on Binance’s homepage had been replaced by the DOT/BUSD pair, giving DOT a lot more exposure.
*On December 31, DOT went ahead to set fresh highs of $8.56
*At its present price of $8.48, DOT has gained 12.34% on the day and 59.76% on a 7-day basis
*Breakout on DOT/USD to highs of $8.56 began on December 28 after Binance Home Page Listing & $10M Endorsement
Key Levels
Resistance Levels: $6.90, $6.00, $5.20
Support Levels: $4.50, $4.00, $3.54
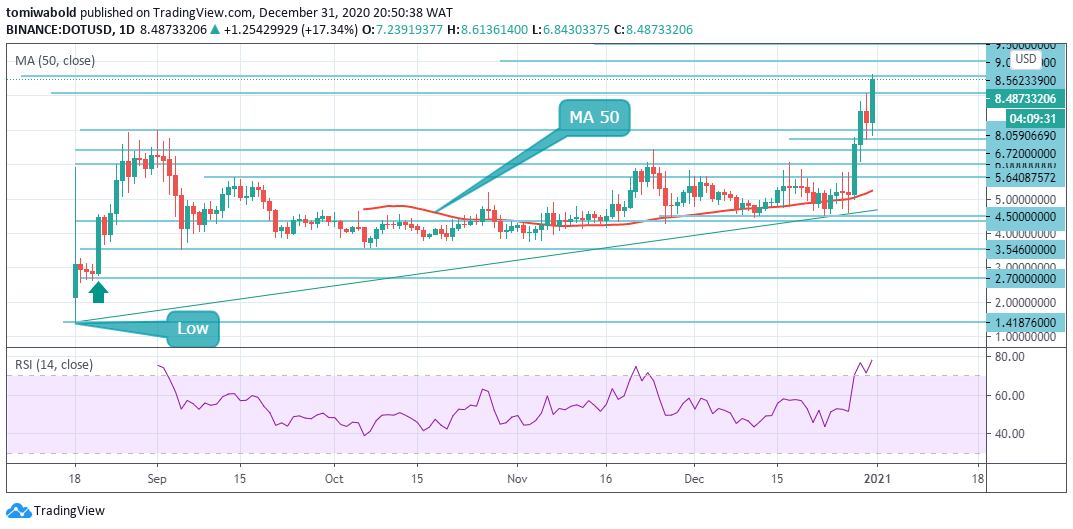
 DOT/USD Daily Chart
Polkadot’s uptrend gathered momentum on December 28 when it rallied from lows of $5.00. The upsloping moving averages and the RSI in positive territory suggest the bulls have the advantage. If the upside momentum is sustained, the DOT price may proceed to $10 and then $12.
On the flip side, if the price turns down from current levels and the bears succeed in pushing the price below $7. Support is envisaged at $6.72 and below this level, a drop to $6.0 and then to $5.24 at the MA 50 is possible. Such a move will suggest that the momentum has weakened and that could keep the pair range-bound for a few days.
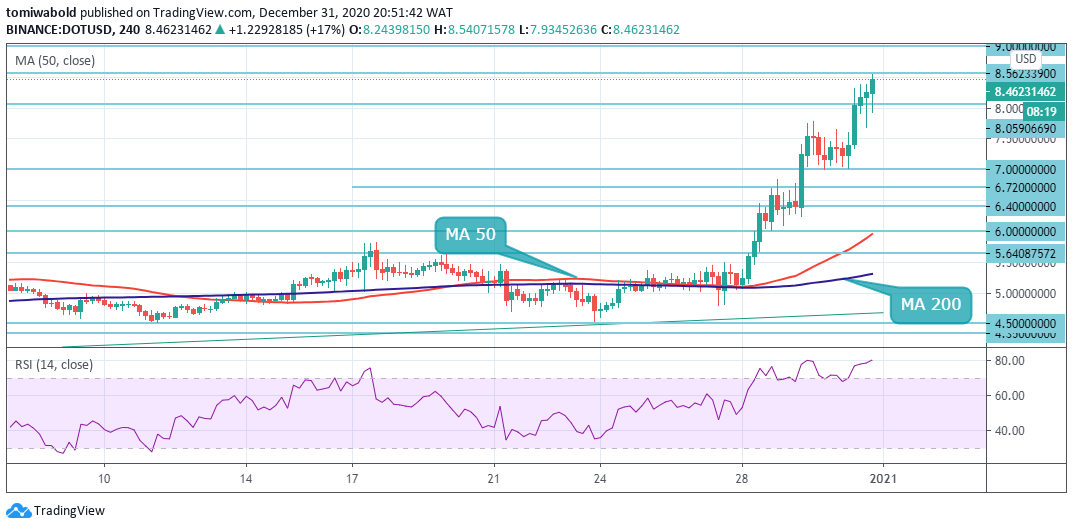
 DOT/USD 4-Hour Chart
As it stands now, DOT/USD is in the bull’s territory. A further push by the bulls may bring the $10 key level to the fore. Polkadot flipped the 4 hour MA 50 and MA 200 into support levels on December 28. The bears will therefore need to push the price below the two moving averages to confirm a bearish outlook. The RSI in overbought levels may suggest an imminent correction.
Barring an extended sell-off, the DOT/USD pair must avoid the sub-$7.00 levels. On the other hand, if $7 gives way, the sell-off may be extended to the next critical level of $6.0 and then $5.6. If this barrier is verified as a support, the near-term bullish trend will be confirmed. The DOT/USD pair is only bullish while trading above the $6 mark, key resistance is found at the $8.56 and the $9.00 levels.
Note: Kryptomoney.com is not a financial advisor. Do your research before investing your funds in any financial asset or presented product or event. We are not responsible for your investing results
Image Credit: Shutterstock
Keep in mind that we may receive commissions when you click our links and make purchases. However, this does not impact our reviews and comparisons. We try our best to keep things fair and balanced, in order to help you make the best choice for you.