
The crypto market is mostly bullish, BTC is making a shot at $37k. Polkadot remains one of the fastest rising crypto assets, in the previous year it flipped other projects to rank among the top 10. Polkadot has been trading in a range after hitting record highs of $20.26 on Jan. 25. The digital asset’s attempt to break out of the range as seen in a run-up to $19.55 on Jan. 29 fizzled out at $17.67 on Jan. 30. After three consecutive days of trading in the green, a bullish advance on DOT/USD pushes Polkadot’s price past $19 on Feb. 3rd. Following the breakout, DOT has gained 13.72% in the last 24 hours and 15.45% on a 7-day basis. At the time of writing, DOT/USD is exchanging hands at $19.24 after reaching intraday highs of $20.24. DOT market cap is ranked 5th on the Coinmarketcap table with the current market capitalization of $16.59 billion, as calculated from a 906 million free float supply. 21Shares, a major provider of cryptocurrency exchange-traded products, or ETP, is set to unveil the world’s first Polkadot ETP on the SIX Exchange. The new product, DOT ETP, will be listed on the Swiss SIX exchange on Feb. 4, 2021.
*Polkadot has been trading in a range after hitting record highs of $20.26 on Jan. 24
*DOT/USD is exchanging hands at $19.24 after reaching intraday highs of $20.24
*DOT ETP will be listed on the Swiss SIX exchange on Feb. 4, 2021
Key Levels
Resistance Levels: $25.00, $22.00, $20.26
Support Levels: $15.00, $12.00, $10.00
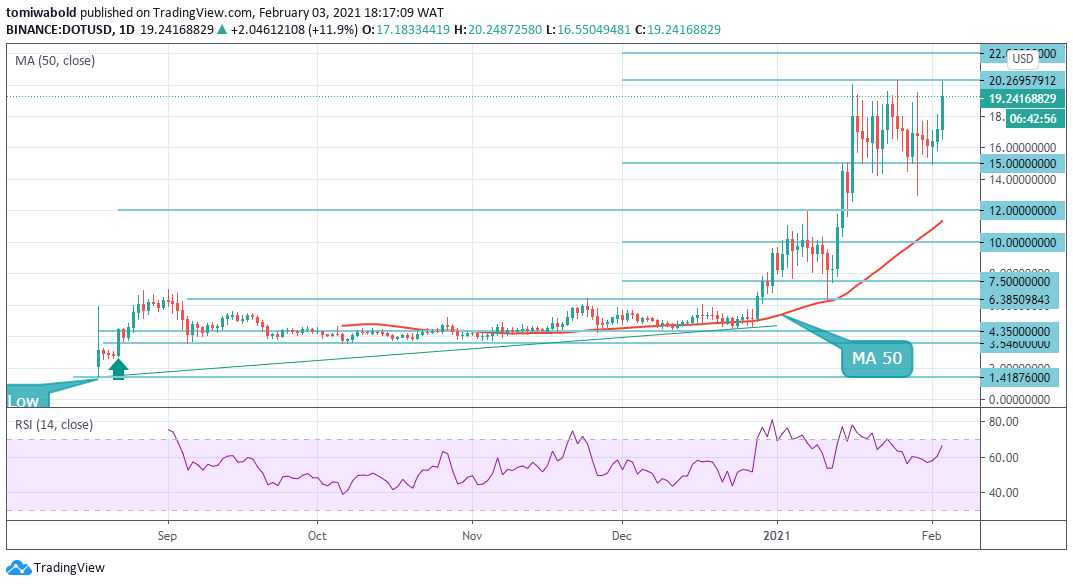 DOT/USD Daily Chart
Polkadot began its run-up from $14.92 lows on Feb. 1 to reach intraday highs of $20.24 on Wednesday. If demand for DOT token doesn’t dry up at the $20.24 high, bulls on DOT/USD may sustain a push past this resistance to reach Jan 2021 highs of $20.26 and then $22.
On the contrary, the failure of the bulls to push the price past $20.24 like a similar rejection that occurred on Jan 25 may lead up to price declines. In this case, a break below the $14.92 mark will be the first sign of weakness. That could pull the DOT/USD pair down to the $12.00 and then the MA 50 at $11.35.
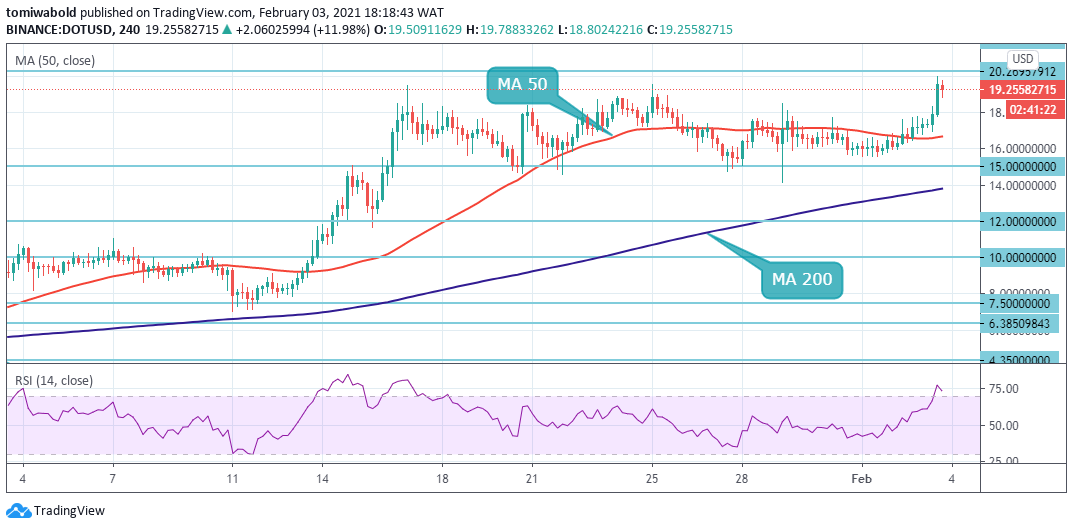 DOT/USD 4-Hour Chart
DOT bulls have reclaimed the MA 50 support on the 4-hour chart, at $16.62 while extending the bullish leg higher. The psychological $22 level and then $25 could come into play if the bulls extend their control beyond the $20.24 high. DOT holding well above the MA 50 and 200 while the RSI in the positive region may indicate more gains ahead.
Alternatively, If the price turns south, the MA 50 resistance now turned support at $16.62 could limit the retracement. The bullish outlook will get invalidated on a sustained move below the buyer congestion zone at around $15. This could lead to a downside move with a price target of $12. The DOT/USD pair stays bullish while trading above the $17 mark, key resistance is found at the $20 and $22 levels.
Note: Kryptomoney.com is not a financial advisor. Do your research before investing your funds in any financial asset or presented product or event. We are not responsible for your investing results
Image Credit: Shutterstock


Keep in mind that we may receive commissions when you click our links and make purchases. However, this does not impact our reviews and comparisons. We try our best to keep things fair and balanced, in order to help you make the best choice for you.