
The cryptomarket uptrend seems intact as BTC surges to new all-time highs of $51,717. While a handful of Altcoins is lagging behind BTC price action, some selected tokens have gone ahead to set new highs. Polkadot (DOT) has once again attained fresh all-time highs at $33.26. This brings Polkadot up by 938% since February 2020. Following a brief consolidation, the DOT token resumed the uptrend on Feb. 15 after embracing support at $23. Following the price action, DOT has gained 2.11% in the last 24 hours and 27.19% on a 7-day basis. At the time of writing, DOT/USD is exchanging hands at $30.78 after reaching intraday highs of $33.26. At a present market capitalization of $28.15 billion, Polkadot tops the 4th largest cryptocurrency flipping Cardano (ADA). DOT has a present circulating supply of 908 million and $5.3 billion in trading volume over the past 24 hours. WEB 3.0 is the project that has caused Polkadot to rise significantly. The Polkadot project recently released a detailed roadmap for the highly anticipated rollout of Parachains and slot auctions, which should mark the full launch of the WEB 3.0 protocol.
*DOT token resumed the uptrend on Feb. 15 after embracing support at $23
*DOT/USD is exchanging hands at $30.78 after reaching intraday highs of $33.26
*The Polkadot project recently released a detailed roadmap for the highly anticipated rollout of Parachains and slot auctions
Key Levels
Resistance Levels: $40.00, $36.00, $33.26
Support Levels: $29.00, $27.00, $25.59
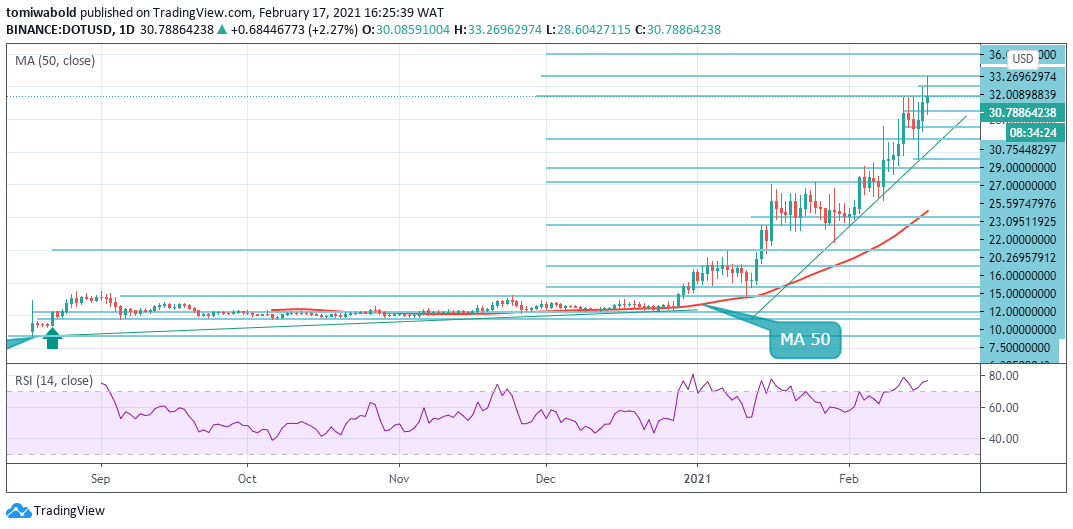 DOT/USD Daily Chart
Polkadot started a rebound from lows of $23 on Feb. 15. The DOT token traded to highs of $33.26 before a slight retreat. In the event of a sustained breakout past the $33.26 barrier, the DOT/USD pair could pick up momentum and rally to $40. The RSI in the overbought zone suggests an advantage to the bulls. On the flipside, Polkadot price gains have always been punctuated by a period of consolidation or minor pullback.
Therefore, a brief consolidation may ensue after this recent climb. A retest of the support at $23 may be quite likely if selling pressure intensifies. The trend will turn in favor of the bears following a breakdown in DOT price below the ascending trend line support at around $23. In this case, Polkadot may seek support at the MA 50 ($16.82).
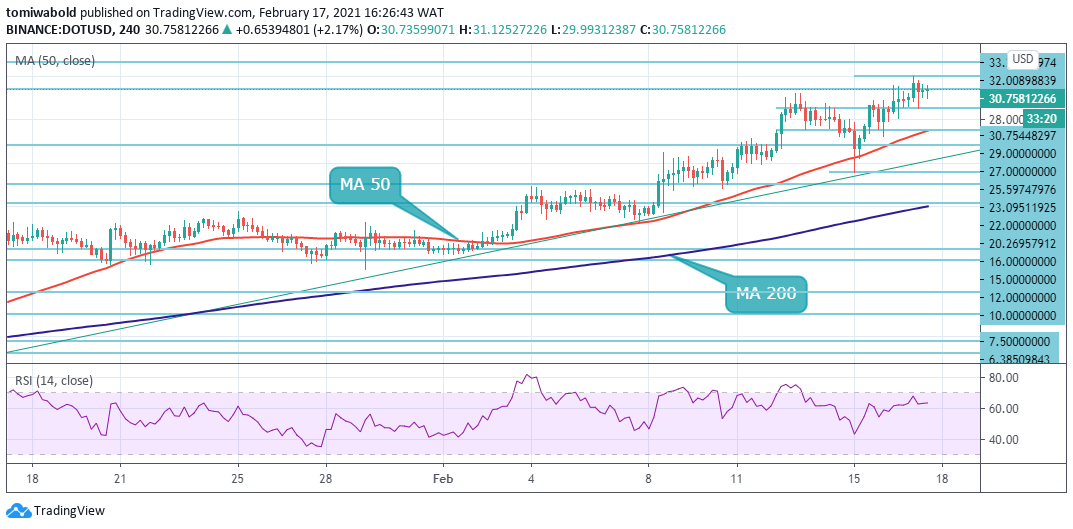 DOT/USD 4-Hour Chart
On the 4-hour chart, Polkadot remains in an uptrend. The upsloping moving averages and the RSI in positive territory lend credence to this. A sustained break past the $33.26 barrier holds the key to an uptrend targeting $36 and then $40. On the flip side, if the price turns down from current levels due to significant resistance, the nearest support level is around $29.
The MA 50 at $27 is in line to offer support if a breakdown ensues. DOT bullish outlook will invalidate on a breakdown below the ascending trendline support. DOT may slide as low as $20 (MA 200). The DOT/USD pair stays bullish while trading above the $27 mark, key resistance is found at the $32 and $33 levels.
Note: Kryptomoney.com is not a financial advisor. Do your research before investing your funds in any financial asset or presented product or event. We are not responsible for your investing results
Image Credit: Shutterstock


Keep in mind that we may receive commissions when you click our links and make purchases. However, this does not impact our reviews and comparisons. We try our best to keep things fair and balanced, in order to help you make the best choice for you.