
The cryptocurrency market is still in a recovery phase after incurring significant losses from the breakdown on Monday. Polkadot traded to highs of $10.28 on January 10 before the entire cryptocurrency market collapsed. Selling by short term traders pulled DOT price down to lows of $6.38 on January 11th. However, the bulls were able to flip the $6.38 level into support causing Polkadot to resume its uptrend. A massive liftoff is seen on the DOT/USD chart to intraday highs of $10.98. DOT market cap is ranked 7th on the Coinmarketcap table with the current market capitalization of $8.98 billion, as calculated from a 220 million free float supply. At current levels, DOT has gained 27.36% on the day and 0.67% on a 7-day basis. DOT/USD is exchanging hands at $10.15 amid a renewed bullish momentum as on-chain data indicates a climb in Polkadot daily volume. On-chain analytics firm, Santiment noted that Polkadot’s daily trading volume is climbing gradually after peaking at $3.5 billion on January 4. The volume dropped early this week to $1.4 billion but now stands at $2.2 billion as of press time.
*Selling by short-term traders pulled DOT price down to lows of $6.38
*DOT/USD is exchanging hands at $10.15 amid a renewed bullish momentum
*Santiment noted that Polkadot’s daily trading volume is climbing gradually
Key Levels
Resistance Levels: $14.00, $12.00, $11,00
Support Levels: $8.00, $6.40, $4.50
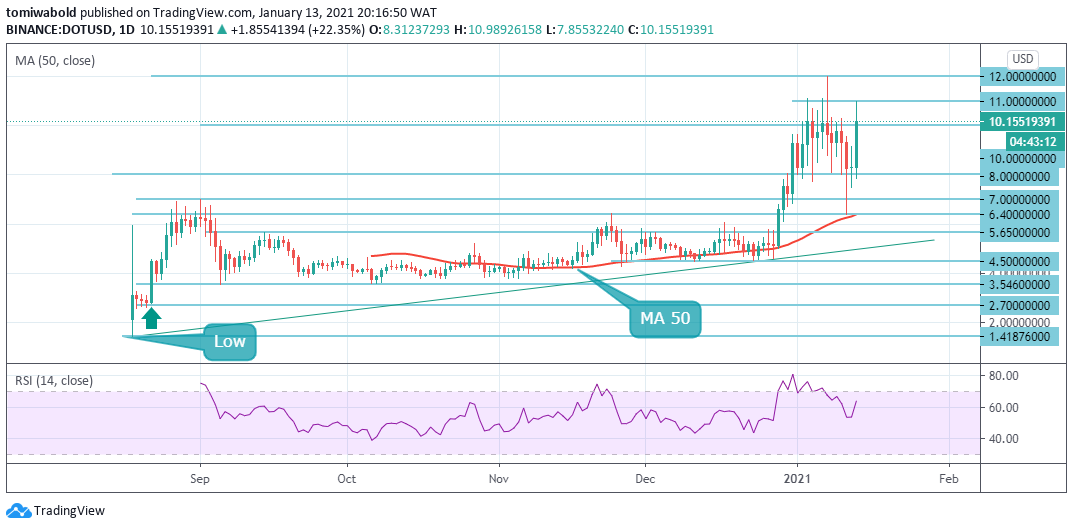 DOT/USD Daily Chart
Polkadot rebounded from support at $7.85 to reach intraday highs of $10.98. The RSI in positive territory suggests the bulls are in control. A further push by the bulls may cause of retest of the January 6 high near $12. The bears may try to pose a stiff challenge at this level but when crossed, the momentum could pick up and the pair could rise to $14.
On the downside, a correction may come into the picture in the event of a rejection, thus revisiting the support at $8.5 and $8.0. If this fails, DOT/USD may be forced to seek the next buyer congestion level at $6.40. The bullish outlook will be invalidated if the bears sink the price below $6.40.
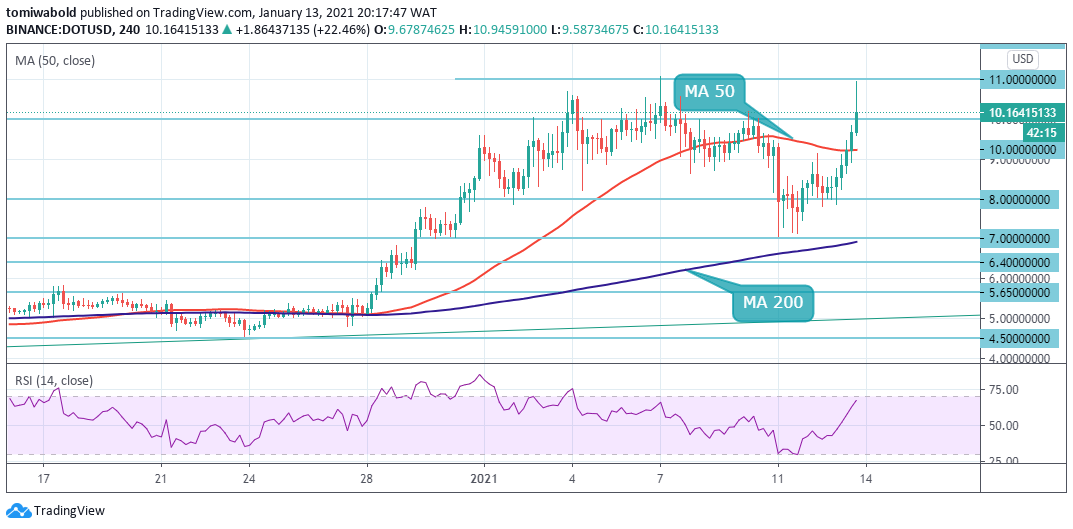 DOT/USD 4-Hour Chart
On the 4-hour chart, Polkadot has reclaimed the support at the two MAs 50 and 200. The bears may need to sink the price beneath the two moving averages to confirm a bearish comeback. Its intermediate support is seen around $8.0.
On the upside, key resistance is seen on the approach to $12 while the bulls may face minor resistance near $11. Once these levels are crossed, DOT/USD may seek to extend upside gains to $14. The DOT/USD pair stays bullish while trading above the $8 mark, key resistance is found at the $11 and $12 levels.
Note: Kryptomoney.com is not a financial advisor. Do your research before investing your funds in any financial asset or presented product or event. We are not responsible for your investing results
Image Credit: Shutterstock


Keep in mind that we may receive commissions when you click our links and make purchases. However, this does not impact our reviews and comparisons. We try our best to keep things fair and balanced, in order to help you make the best choice for you.