
The cryptocurrency market is mainly in green. Cryptocurrencies across the board had a memorable weekend session, with most of them rallying to new yearly highs. After going live in mid-August on exchanges when the Polkadot network performed a 100:1 split, Polkadot dropped from its highs of $6.85 to enter a consolidation stage. Presently the Dot token is up nearly 50% from its August lows to trade past $5 in the last few days. However, DOT’s upside movement has been capped under $6 which has served as a barrier since early September. Despite this, Polkadot is trading in the green, up by nearly 4% since the day’s start and 28.91% on a week-to-week basis. At the time of writing, Polkadot is trading up at $5.76. The market cap is ranked 8th on the Coinmarketcap table and currently stands at $4.99 billion with $857 million in trade volume over the past 24 hours. Polkadot is set to recreate ETH on its blockchain with projects that seek to become a kind of Ethereum emulator running on the same virtual environment that is currently powering all smart contracts on Ethereum. Derek Yoo, Polkadot project lead stated this is what DOT intends to do with the Moonbeam Parachain project.
*Presently the Dot token is up nearly 50% from its August lows to trade past $5 in the last few days
*Polkadot is trading in the green, up by nearly 4% since the day’s start and 28.91% on a week-to-week basis
*Polkadot is set to recreate ETH on its blockchain with projects that seek to become a kind of Ethereum emulator
Key Levels
Resistance Levels: $6.9, $6.4, $6.0
Support Levels: $5.64, $5.20, $4.35
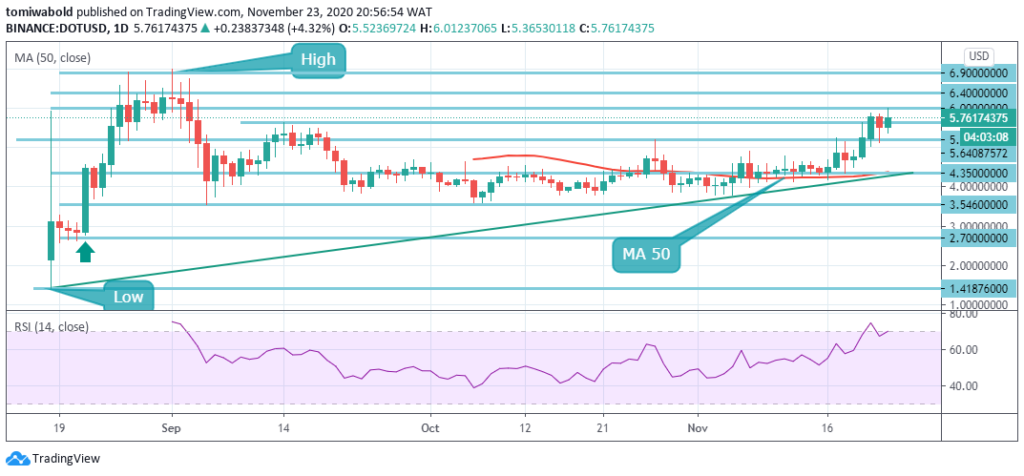 DOT/USD Daily Chart
As seen on the daily chart, the DOT upside move has been capped beneath $6 in the last few days. If the buyers can propel the price above the $6 level, the DOT/USD pair may rally to $6.40, then to the highs at $6.90. For now, the bulls seem to be in control as seen in a positive RSI value.
On the flip side, the bears will attempt to defend the key resistance at $6. If bears managed to stall this present upside move at $6, the pair could consolidate between $4.35 and $5.64 for a few days. The bears will take full control if the price breaks beneath the breakout level of $5.20.
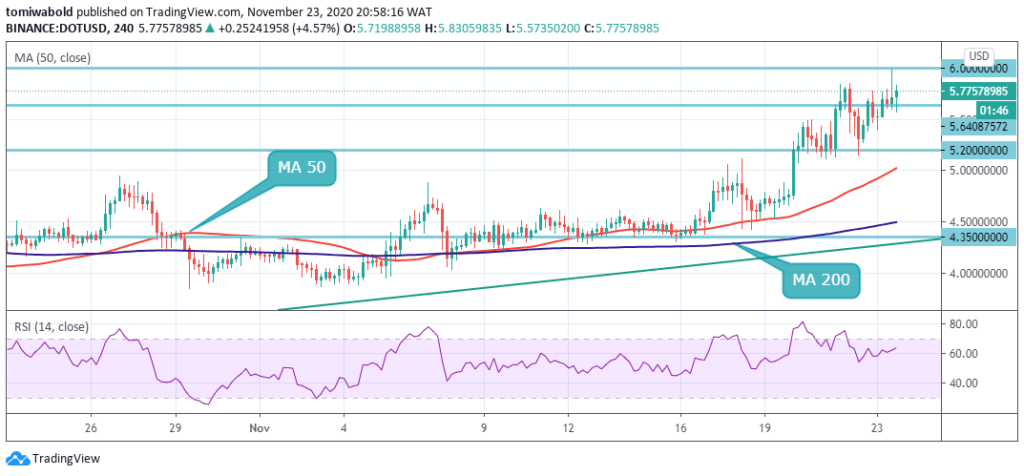 DOT/USD 4-Hour Chart
On the 4-hour chart, DOT faced significant resistance on its approach to $6 which slowed down the bulls. DOT trading remains in the range following bulls and bear standoff. DOT must close above the key level of $6 to sustain the uptrend targeting $6.5 marks, bringing into the light a bullish outlook with a likely chance of reaching prior highs of $6.90.On the other hand, if DOT/USD fails to close $6, a reversal may also come into the picture.
Selling orders are likely to increase, forcing Polkadot to seek refuge in the range between the 4 hour MA 50 at $5 and the MA 200 at $4.5. Although while trading beyond the $5 marks, the DOT/USD pair is only bullish; the main resistance is found at the $6 and $6.5 level. If the DOT/USD pair is trading beneath $6, the 4 hour MA 200 and 50 zone support levels may be tested by sellers.
Note: Kryptomoney.com is not a financial advisor. Do your research before investing your funds in any financial asset or presented product or event. We are not responsible for your investing results
Image Credit: Shutterstock


Keep in mind that we may receive commissions when you click our links and make purchases. However, this does not impact our reviews and comparisons. We try our best to keep things fair and balanced, in order to help you make the best choice for you.