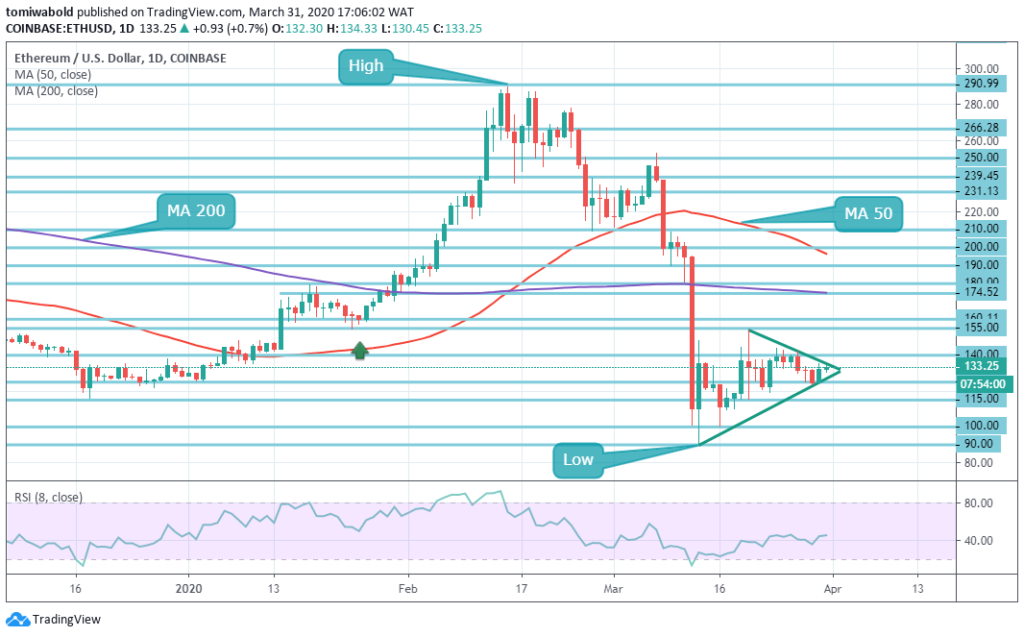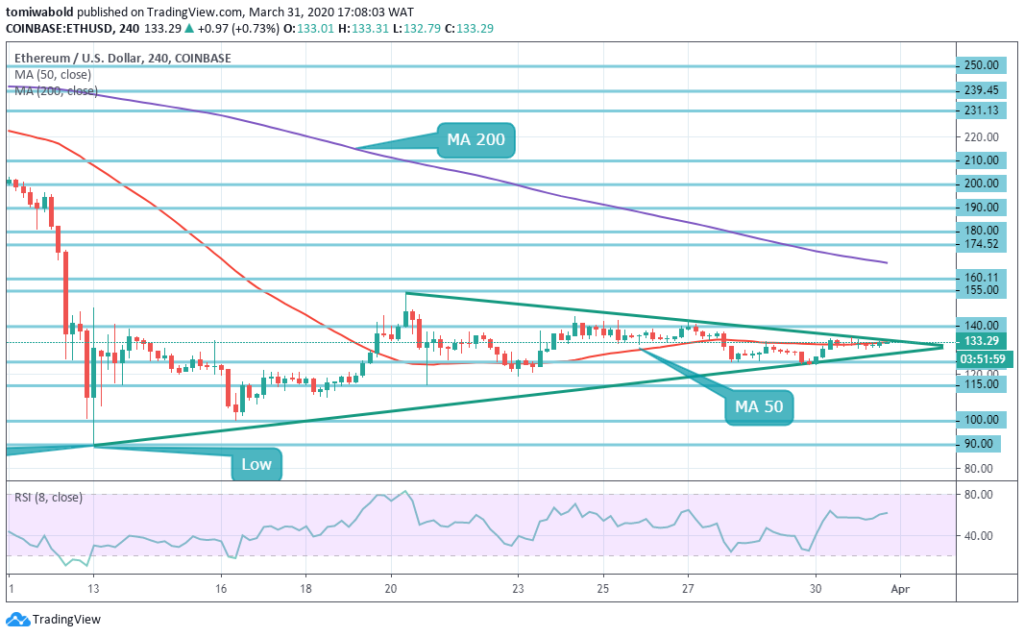
Altcoin King, Ethereum the second-largest digital currency with its total market cap of $14.7 billion and an estimated daily trading volume of $11.2 billion has risen by 1.5 percent in the last 24 hours and consolidated around $133.00 as at when composing. Amid the upside traction, ETH/USD remains stuck inside the triangle, as it nears the axis breakout. From the weekend lows at $125 to levels over $135, the prior session gains were able to hold. In April, co-founder Vitalik Buterin says Ethereum 2.0 Multi-User Testnet is set to go live. ETH 2.0 is just months ahead, and information from research leaders Danny Ryan and Vitalik Buterin about a Multi-User Testnet have filtered out. The Multi-User Testnet phase is the final phase until the full release to the mainnet of the new Ethereum 2.0.
*ETH/USD consolidation nears triangle axis breakout
*The gains of the prior session was able to hold from the weekend lows at $125 to levels over $135
*In April, co-founder Vitalik Buterin says Ethereum 2.0 Multi-User Testnet is set to go live
Key Levels
Resistance Levels: $210, $180, $155
Support Levels: $125, $115, $90.0
 This week’s Ethereum price has a bullish beginning for the 2nd day in a row. From the weekend lows at $125 to levels over $135, the prior session gains were able to hold. The buyers pushed the bullish phase past $135 level but failed to maintain gains toward the key barrier of $140 level.
The European session has been marked by a broader bullish push although the bulls tend to lose adequate momentum to maintain the gains. The horizontal level beneath is also in line offering support at $125.01 level backed by the upward trendline.
 ETH/USD recovery is capped by a $134.33 (high) level on the intraday charts. This resistance is established on the 4-hour chart via the convergence of MA 50 and the upper triangular line of the triangle structure. Whenever it’s breached, the upside is likely to gain momentum to $140.00 psychological level as the next emphasis while the next obstacle appears at $155.00, the highest level since 20th March.
Specific relevant technical indicators lead to a good technical view for Ethereum and, for example, the recovery of the RSI from levels nearly 30 (through the weekend) has gone past 50. On the contrary, the psychological $125.00 level of horizontal support provides initial support located right below this level. A sustained shift underneath this level may increase the bearish pressure and approach the next low level at $115.00 probably.
Note: Kryptomoney.com is not a financial advisor. Do your research before investing your funds in any financial asset or presented product or event. We are not responsible for your investing results
Image Credit: Shutterstock
Keep in mind that we may receive commissions when you click our links and make purchases. However, this does not impact our reviews and comparisons. We try our best to keep things fair and balanced, in order to help you make the best choice for you.