
The cryptocurrency market has entered a phase of indecision as it awaits either a Bitcoin break above $40,000 or a continuation of the consolidation range down to $30,000. Roadmaps for future market movements can be linked to the overall performance of the lead crypto. As the range trading proceeds, rising Bitcoin influence may spark Ethereum declines. The world’s second-largest cryptocurrency, ETH has mimicked the trajectory of Bitcoin with a May 23, bounce-off lows at $1,728. However, it has failed to attempt the psychological MA 50 barrier at $2,900. ETH is down past 7% after rallying to $2,640 at the start of the week. During the time of writing, Ethereum was trading at $2,247. In contradiction to Bitcoin, though, Ethereum continues to make lower highs, indicating that the Altcoin market is weakening against Bitcoin. To re-establish the bulls, Ethereum must break through the arduous $2,900 resistance level, albeit this is only likely to happen if Bitcoin makes a decisive move above $40,000.
Key Levels
Resistance Levels: $2,900, $2,650, $2,300
Support Levels: $2,000, $1,728, $1,545
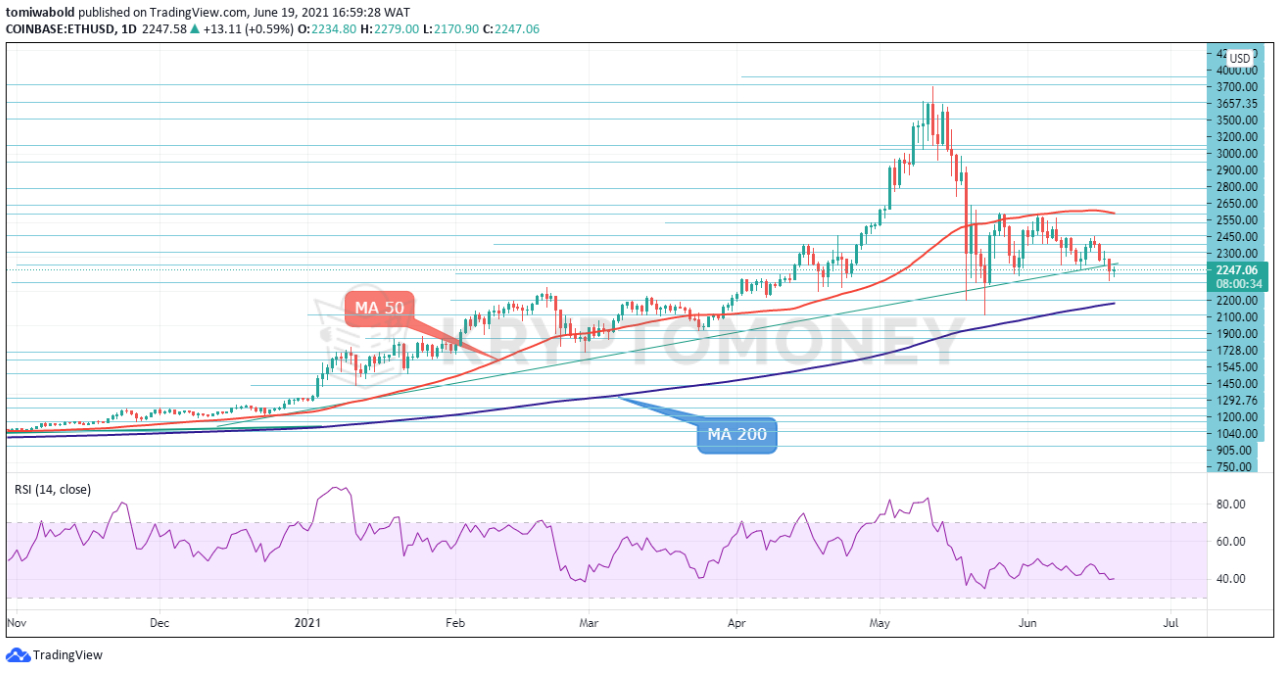 ETH/USD Daily Chart
For the 2nd week in a row, ETH price remains bounded in a range as the market failed to breach barriers and take a decisive direction. ETH/USD is mildly lower as it technically breached the $2,200 minor support zone but quickly recovered while extension may be limited. However, the sustained break of the $2,200 zone will indicate a medium-term bearish reversal.
At the same time, eyes will also be on $2,000 support in ETH/USD. Break there will suggest that the pair have topped up on the daily chart in the near term, and bring a deeper pullback. Technically, the ETH may maintain more downside for now, unless the upside barrier up till the $2,500 levels is broken decisively.
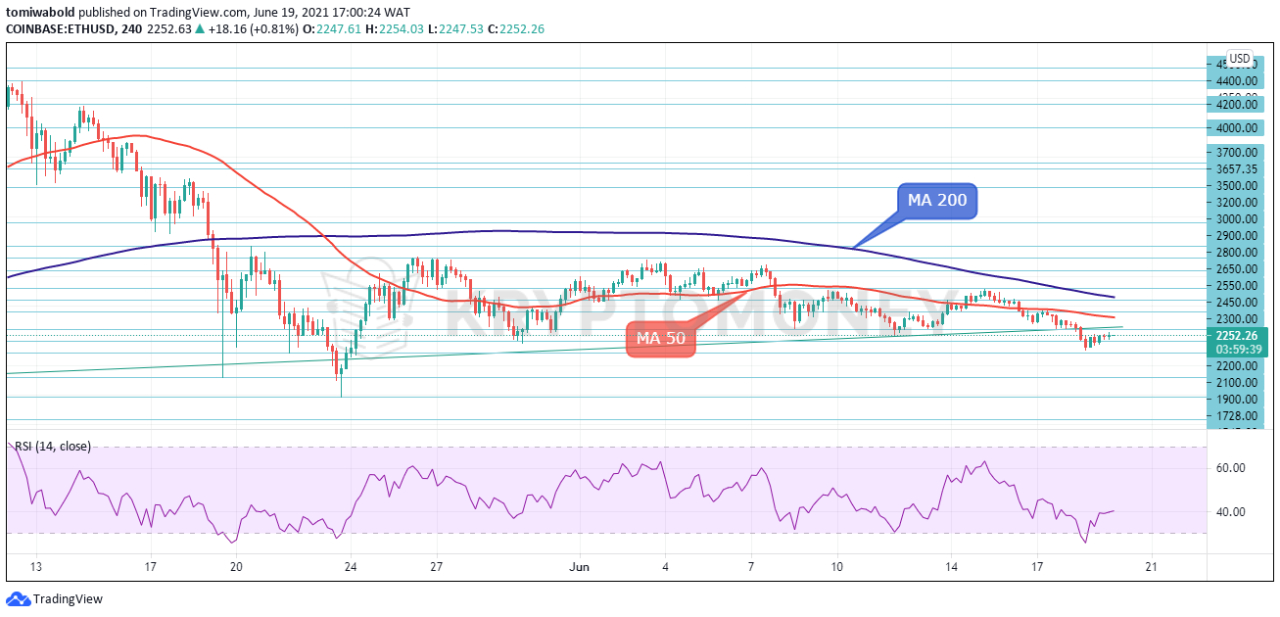 ETH/USD 4-Hour Chart
The present weakening in Ethereum, as observed on the 4-hour time frame, could eventually lead to ETH/USD retesting its $2k support. If this price region fails to hold, the pair’s next probable support zone is $1,728 May 23 low. The pair remains beneath the short-term moving averages (MA 50 and MA 200). As a result, the pair may experience a major retreat shortly.
To avoid any sharp losses in the ETH/USD pair, bulls must retain the price of Ether above $2,000. Bulls are likely to try back towards the $2,900 resistance level if they can overcome the $2,500 mark in the following sessions. Only when the ETH/USD pair is trading beneath $2,000 is it negative; major support is identified at $1,728 and $1,545.
Note: Kryptomoney.com is not a financial advisor. Do your research before investing your funds in any financial asset or presented product or event. We are not responsible for your investing results
Image Credit: Shutterstock


Keep in mind that we may receive commissions when you click our links and make purchases. However, this does not impact our reviews and comparisons. We try our best to keep things fair and balanced, in order to help you make the best choice for you.

