
Crypto prices have plummeted, owing to fears that the bankruptcy of embattled Chinese property giant Evergrande might trigger a global recession. Ether’s price was headed to $3,700 before technical trading kicked in and sold on the uptick. Since, ETH has dropped by more than 10%, reaching support at $2,805 on Tue. Sept 21. However, ETH dip buyers injected liquidity as bears damage stays limited above the $2,500 support. As of writing, ETH/USD is hovering beneath the $3,000 level, recovering from daily lows. Ethereum’s rally, like Bitcoin’s, appears to be a dead cat bounce, and it remains vulnerable to more chaotic sell-offs in the current market. Ethereum has risen to roughly $3,104 as concerns about a crisis risk posed by Chinese real estate developer Evergrande diminish. The recovery is in line with other financial assets as analysts debate whether cryptocurrencies have proven a close correlation to the performance of stocks and other risk-on assets.
Key Levels
Resistance Levels: $3,700, $3,500, $3,200
Support Levels: $2,800, $2,500, $2,300
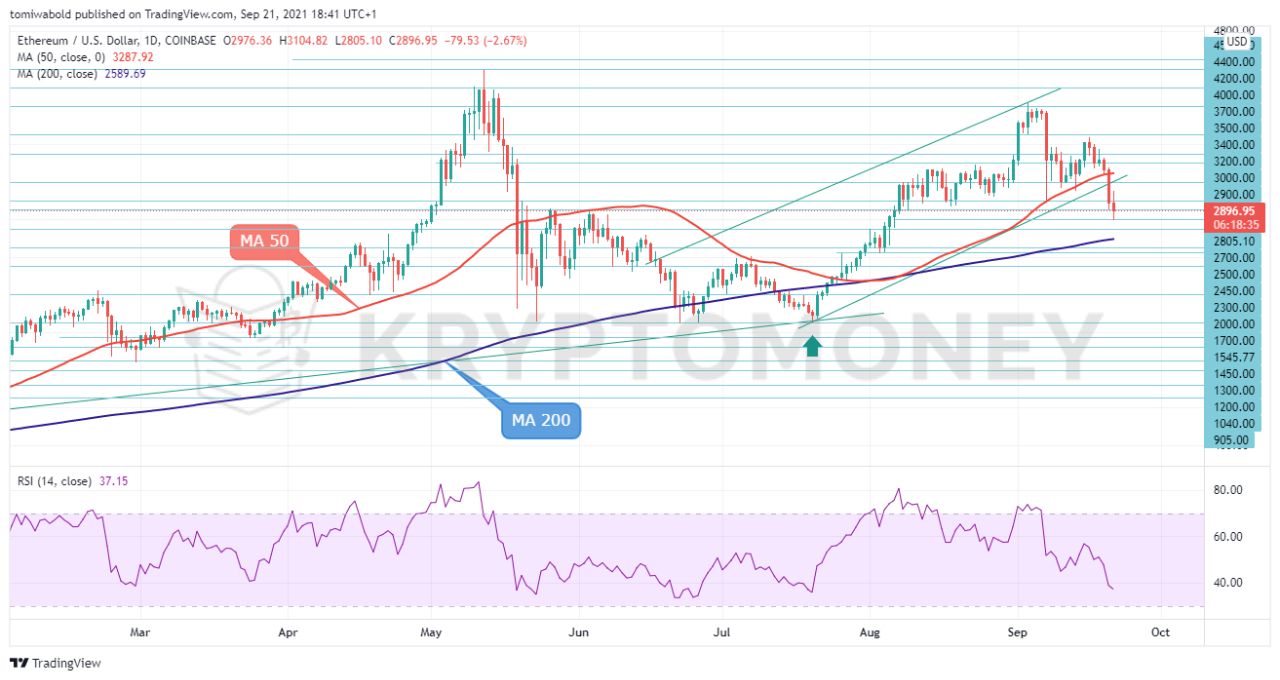 ETH/USD Daily Chart
After a multi-day struggle with the moving average (MA 50) and the $3,200 support zone, where a dashed ascending trendline also happens to be, ETH/USD plunged to an almost one-month low of $2,805 on Tuesday. The no.2 crypto is currently attempting to mend its wounds from the fall, but downside risks remain, as the Relative Strength Index remains comfortably below its 50 neutral marks.
The moving average (MA 200) might get tested as the price is far from the oversold area, and the candlestick remains stretched within the negative zone and below the $3,000 psychological level. In terms of market structure, despite the current sell-off, the three-month-old upside trajectory remains in place, with only a convincing close below the $2,800 and MA 200 barrier at $2,600, shifting the ETH/USD back on the bearish path.
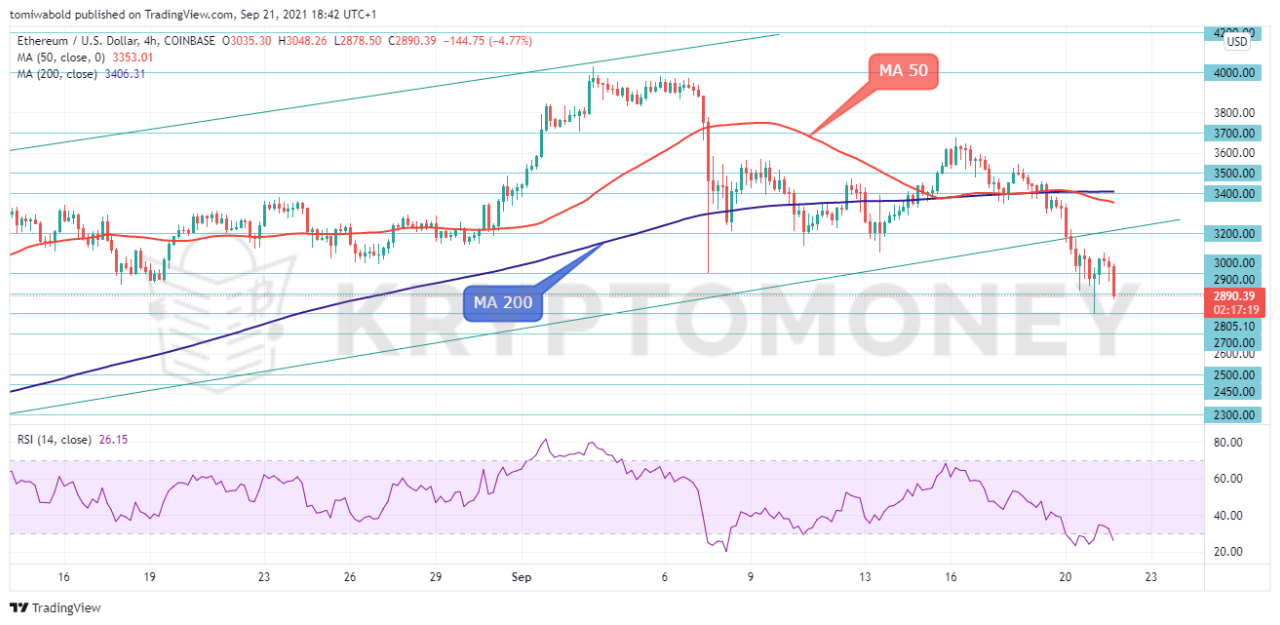 ETH/USD 4-Hour Chart
On the 4-hour time frame, despite today’s drive for a comeback, the technical signs for ETH/USD remain bearish. A move below $2,800 might bring in additional sellers, changing the picture to negative, while a rise past $3,200 could increase buying exposure in the market. If it continues unabated, the $3,400/$3,500 resistance zone will be tested, with a break opening the way for the $4,000 handle.
On a closing basis, a failure of $2,800 implies a possible capitulation to $2,600/$2,500 support clusters. If that’s the case, support comes next in the $2,300–$1,718 restricted area, which was the last active between the May and July of 2021. Technically, the RSI indicator shows oversold on the 4-hour chart. Hence, likely sellers will attempt to exit from this region in the short term as more increases could shift the bearish bias to bullish.
Note: Kryptomoney.com is not a financial advisor. Do your research before investing your funds in any financial asset or presented product or event. We are not responsible for your investing results
Image Credit: Shutterstock


Keep in mind that we may receive commissions when you click our links and make purchases. However, this does not impact our reviews and comparisons. We try our best to keep things fair and balanced, in order to help you make the best choice for you.


