
As ETH struggles to keep up, a negative vibe is being felt across the cryptocurrency markets, while calls for regulation and Miners’ migration from China caused an eruption of risk aversion, reviving fears over a possible selloff. In a move that raised the possibility of a sustained rebound, Ethereum (ETH) attempted to flip the moving average (MA 50) barrier and reached as high as $2,411 during the mid-week trading. Despite a show of strength, ETH/USD has reversed gains and registers weekly lows at $2,050. After the recent crash recorded in May and June, ETH prices have unexpectedly held up steady ahead of the $2,000 level. These repeated signs of easing from medium-term highs could plant a seed of doubt among investors about whether Ethereum remains on its journey to flip Bitcoin. At the time of this post, ETH/USD was trading at $2,110. Bearish expectations are likely to deteriorate further on the forthcoming Ethereum mainnet London hard fork, set to go live on Aug. 4th; as this could be good news for Ethereum bulls.
Key Levels
Resistance Levels: $2,800, $2,500, $2,200
Support Levels: $2,000, $1,700, $1,500
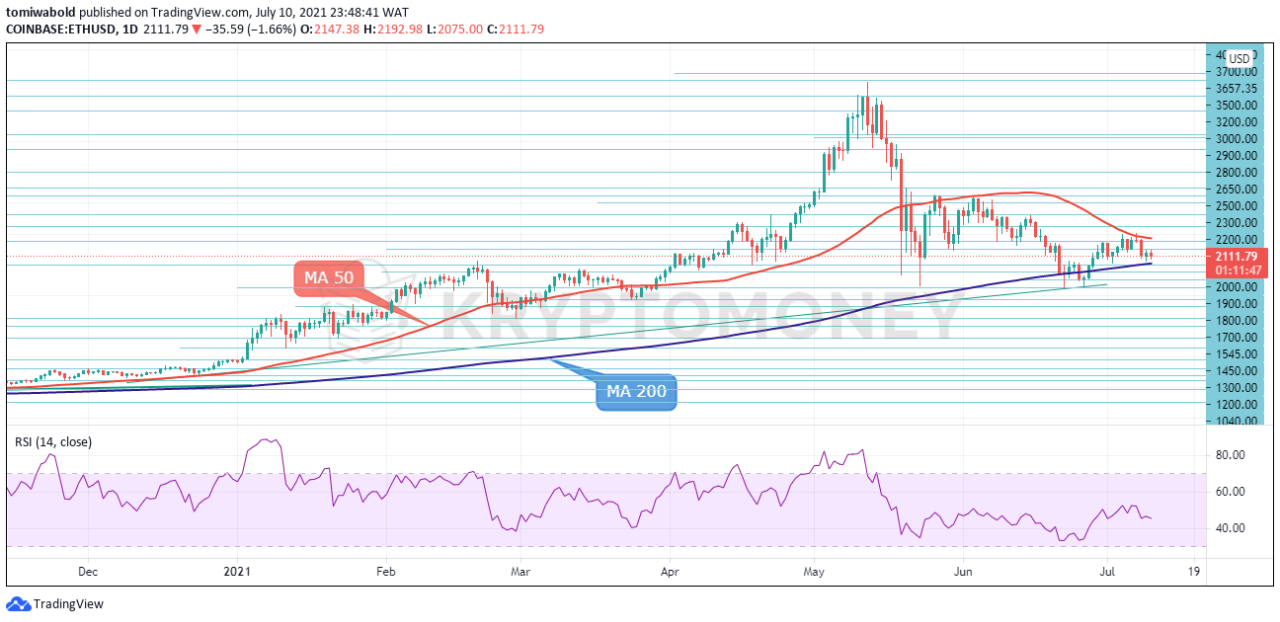 ETH/USD Daily Chart
The ETH has tumbled below the moving average (MA 50) zones since its crash on 19th May 2021. With uncertainty eroding buying sentiment towards the ETH, the pair has scope to extend losses. Previous support beneath the moving average (MA 200) zones could transform into a dynamic resistance that encourages a decline towards a rebound zone of $1,700 level.
A look at the technical picture, the ETH/USD pair is under noticeable pressure on the daily charts with prices trading marginally below the $2,200 barrier as of writing. Sustained weakness below the moving average (MA 200) at $2,000 near term support could encourage a decline towards $1,700 and $1,500, respectively. A break higher past $2,200 will alter the trend.
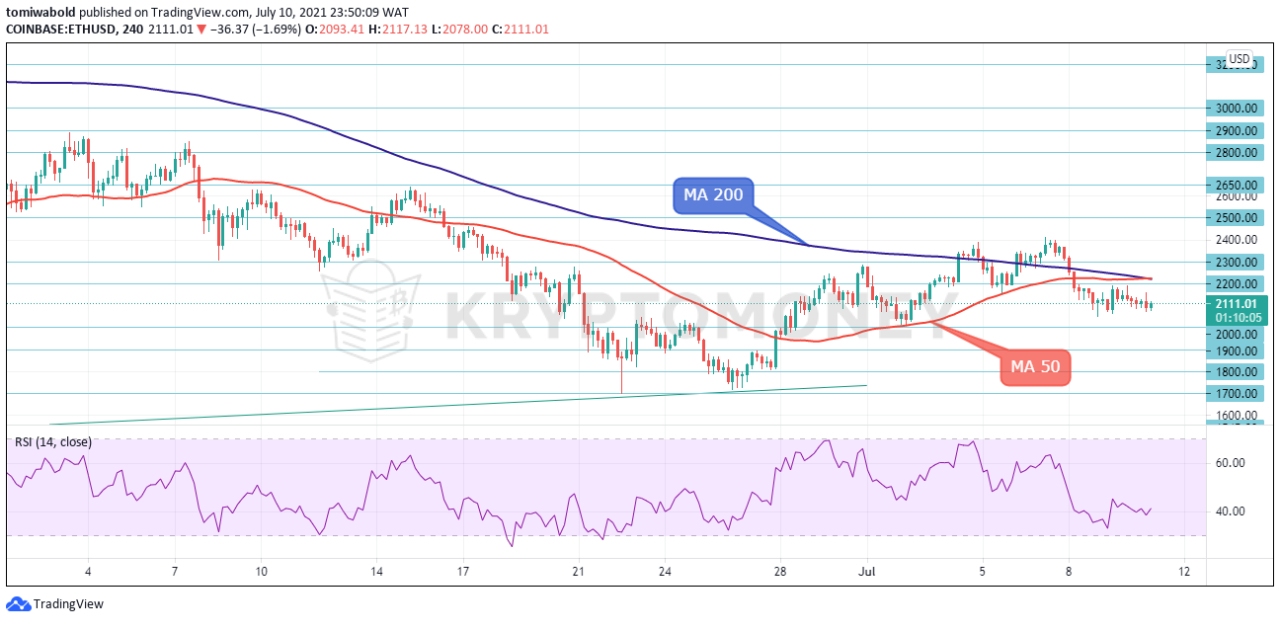 ETH/USD 4-Hour Chart
On the 4-hour time frame, the technical picture of the Relative Strength Index (RSI) looks incredibly bearish, especially when considering how the ETH/USD plummeted to a low below the short-term MA 50 and MA 200. Sustained weakness below $2,000 could inspire a decline towards $1,700. However, losses were limited above $2,000 on positive sentiment.
With the no. 2 Crypto closing ahead of $2,000 today, the downside momentum could halt and open a higher path towards $2,300 in the new week. Alternatively, a failure for bulls to maintain control above $2,000 may invite a decline back towards $1,700, June lows. ETH’s positive sentiment may continue to boost prices in the short to medium term.
Note: Kryptomoney.com is not a financial advisor. Do your research before investing your funds in any financial asset or presented product or event. We are not responsible for your investing results
Image Credit: Shutterstock


Keep in mind that we may receive commissions when you click our links and make purchases. However, this does not impact our reviews and comparisons. We try our best to keep things fair and balanced, in order to help you make the best choice for you.