
Ethereum price surged above $3,200 in reaction to a rise in U.S inflation figures on Thursday. However, ETH/USD lost around 3.14% since the start of the day, bouncing back to $3,089 from the $3,284 intraday high reached during the session. The observed pullback appears to be a technical corrective action to reduce the limitations on its advance towards $3,500. ETH correction from a high of $3,285 comes against a relatively bullish backdrop. As a result, ETH/USD is experiencing a slower rebound relative to recovery from its earlier rebound. The cryptocurrency market is under increased pressure as expectations for an even more hawkish Fed rise after inflation figures return higher than expected. Meanwhile, Ether whales have transferred over $1.3 billion worth of Ethereum as per crypto tracking service, WhaleStats. 11 large swaths of ETH were transferred between anonymous crypto wallets, according to the crypto tracker. In total, 415,610 ETH were moved, in 11 major transfers, with an amount worth more than $1.3 billion.
Key Levels
Resistance Levels: $3,700, $3,500, $3,300
Support Levels: $3000, $2,700, $2,500
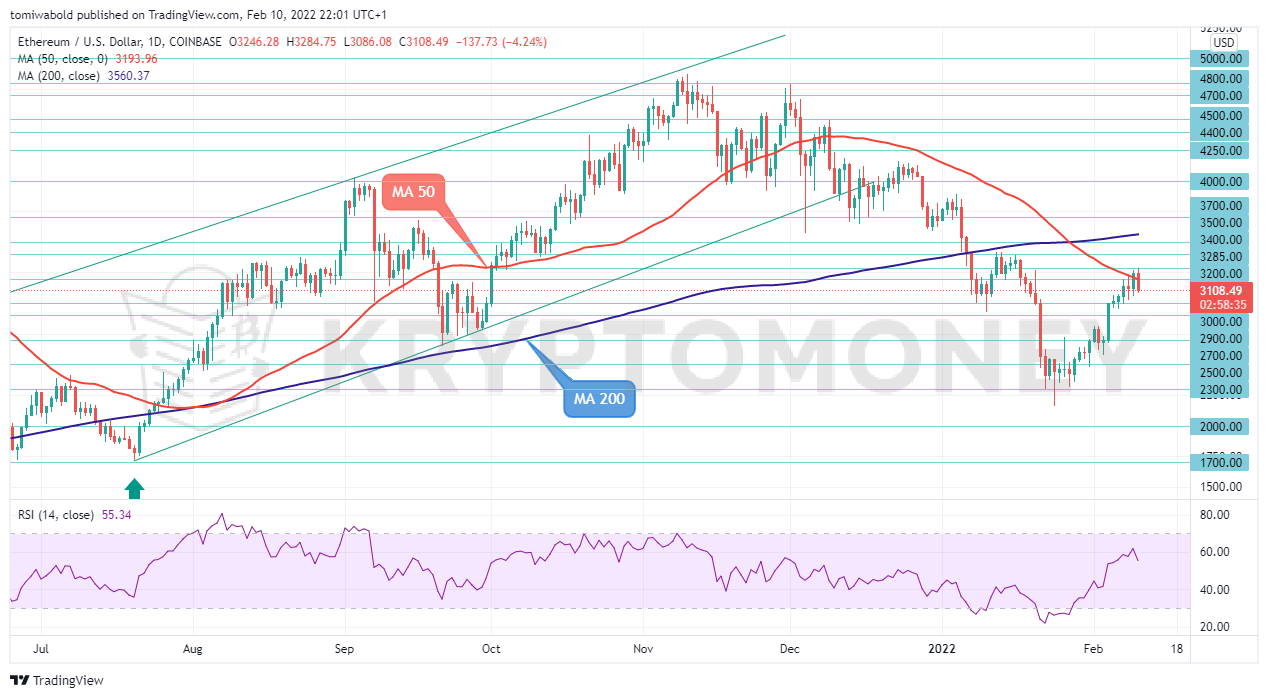 ETH/USD Daily Chart
ETH/USD has recovered some lost ground after its decline ceased at the $2,159 region. However, on the daily chart, its ongoing rebound seems to be faltering as the price retreated from an intraday high of $3,285 and might adopt a more sideways pattern in the next sessions to come. The daily moving average (MA 50) serves as a pivot zone for ETH price.
Although the momentum indicators suggest that bullish forces are still prevailing, ETH/USD upside push must flip the $3,300 level to sustain the bias. More noticeable is the relative strength index sloping downwards, yet hovering up above its 50-neutral mark. Overall, ETH/USD indicates that its directional forces might remain tilted to the upside.
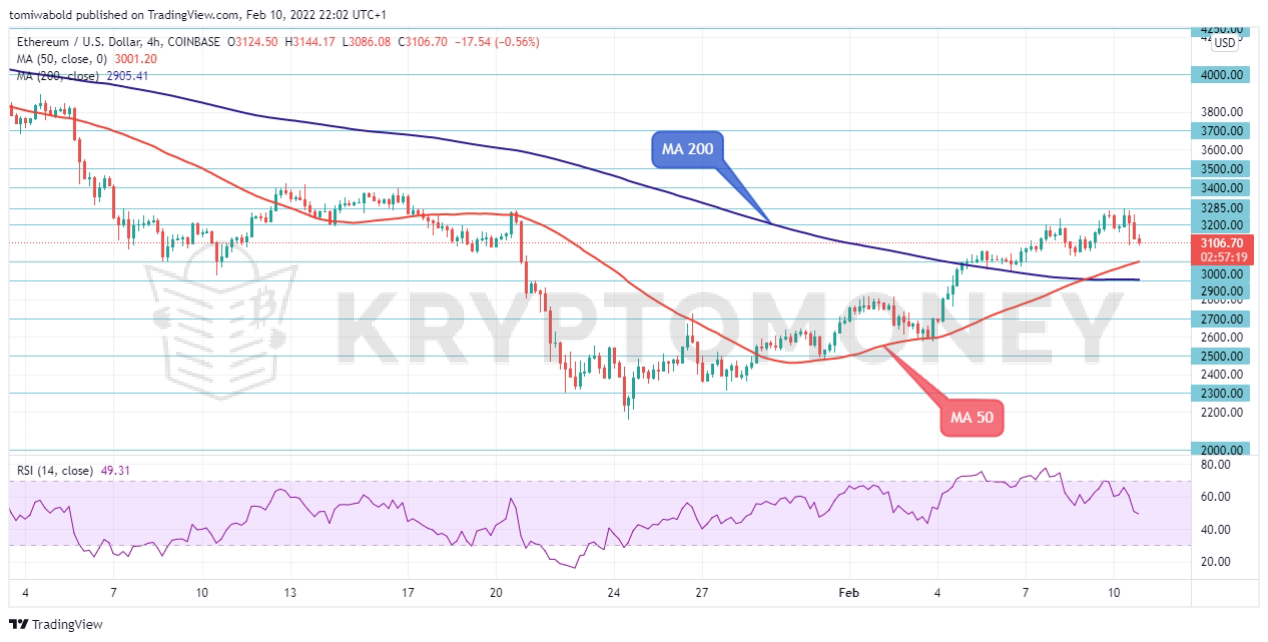 ETH/USD 4-Hour Chart
ETH/USD’s bullish bias strengthens on the 4-hour chart as the price surges above $3,200. Sellers might force Ether below the $3,000 trough to begin to dent the bullish bias. Above $3,000 – $3,285 hurdle, however, the bullish bias remains intact. On the other hand, if negative forces regain control, it could find immediate support below MA 50 at $2,900.
On the upside, a clear break above the $3,285 ceiling might signal the resumption of its recent rebound, whereas a dive below $3,000 could endorse the short-term downside trajectory. Ether’s neutral-to-bullish bearing is questioned as upside pressures seem weak, currently lacking the ability to overstep the $3,285 – $3,300 impeding obstacle.
Note: Kryptomoney.com is not a financial advisor. Do your research before investing your funds in any financial asset or presented product or event. We are not responsible for your investing results
Image Credit: Shutterstock


Keep in mind that we may receive commissions when you click our links and make purchases. However, this does not impact our reviews and comparisons. We try our best to keep things fair and balanced, in order to help you make the best choice for you.