
Ethereum has been closely tracking Bitcoin’s price action as of late, which has caused it to see some large volatility. ETH/USD is in the process of pushing higher today, with buyers aiming at taking the king Altcoin beyond its 2020 highs. The ETH/USD pair has been in a downside correction with a 2nd recovery wave beyond $580. Despite retreating at $636.50, ETH/USD resumes another bull attempt to print a fresh high in the $700 region. After opening from a low of $586, ETH has surged to a $624 intraday high. The crypto asset is currently second on the Coinmarketcap table, with a market cap of $69.72 billion and $14.58 billion in trade volume over the past 24 hours. The king Altcoin is dancing around $614 while bulls push for gains toward the $636.50 high level. Ever since the launch of the PoW consensus model for Ethereum, the community has been hard at work in transiting to Ethereum 2.0. After weeks of investors actively staking their ETH in deposit smart contracts, Ethereum 2.0 went live at noon UTC on December 1st.
*The ETH/USD pair has been in a downside correction with a 2nd recovery wave beyond $580
*Despite the barrier at $636.50, ETH/USD resumes another bull attempt to print a fresh high in the $700 region
*Ever since the launch of the PoW consensus model for Ethereum, the community has been hard at work in transiting to Ethereum 2.0
Key Levels
Resistance Levels: $750, $700, $650
Support Levels: $600, $563, $488
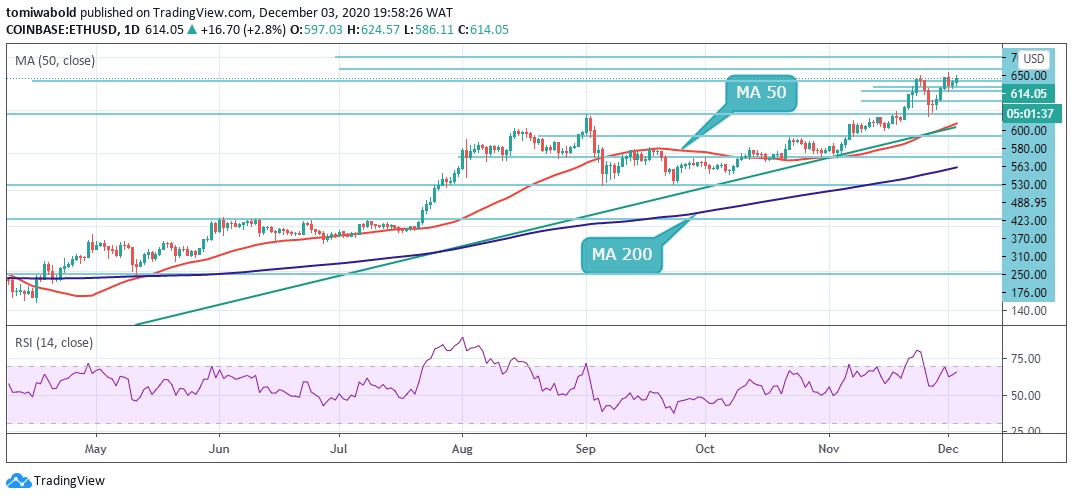 ETH/USD Daily Chart
On the daily chart, Ethereum price has surged above the confluence zone at $600 hitting a $624 intraday high, and quickly lost steam. The area around $610 is the strongest resistance region. A sustained move past this level can quickly drive ETH/USD price to new highs at $700. Above this area, there is practically no more opposition in comparison to the support below, which adds credence to the $1,000 potential price target for ETH.
On the other hand, ETH/USD seems to have more sellers located at known supply zone such as the $600 level. A sustainable move beneath the $600 is needed to confirm a bearish scenario. Failing to settle above will attract more sellers to the market and push the channel support price below $580. If this is the case, the sell-off may be extended beneath the $550 mark. If this level gives way, $530 will come into focus.
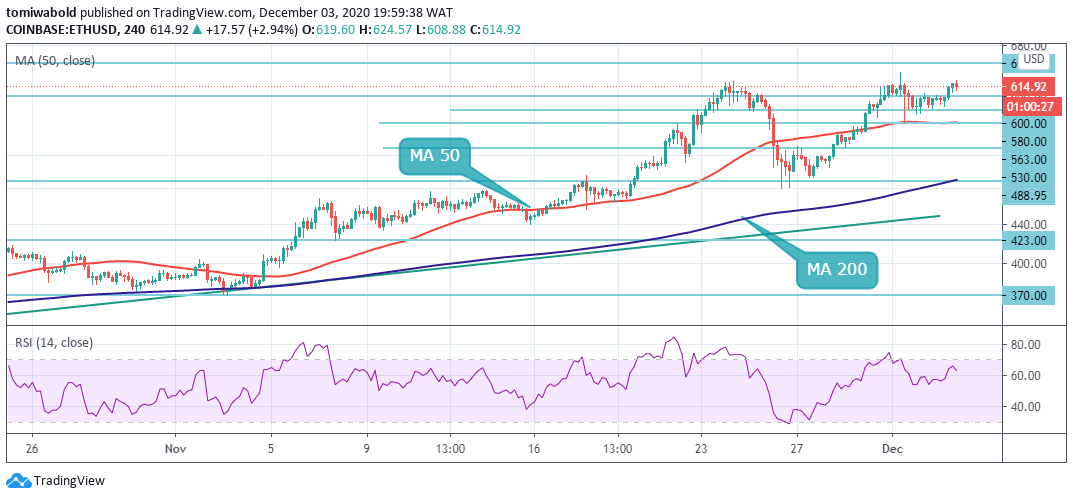 ETH/USD 4-Hour Chart
ETH/USD has resumed its upward traction, further increasing the chances of a short-term pullback. Any such weakness beneath the $600 resistance turned support level could see the ETH/USD pair reversing towards the $580 area. Technical analysis shows that medium-term traders are probably going to stay bullish towards the ETH/USD pair while price trades beyond the 4 hour MA 200 at the $488 level.
Bulls are holding a crucial support level of around $610 in the short-term, which gives them better odds to see a breakout in the next few sessions. The ETH/USD pair is only bullish while trading beyond the $563 level around the MA 50, key resistance is found at the $650 and the $700 levels. If the ETH/USD pair trades beneath the $580, sellers may test the $563 and $530 support levels.
Note: Kryptomoney.com is not a financial advisor. Do your research before investing your funds in any financial asset or presented product or event. We are not responsible for your investing results
Image Credit: Shutterstock


Keep in mind that we may receive commissions when you click our links and make purchases. However, this does not impact our reviews and comparisons. We try our best to keep things fair and balanced, in order to help you make the best choice for you.
