
The cryptocurrency market is bullish with BTC setting new all-time highs. Altcoins tagged along this time as the largest Altcoin, Ethereum (ETH) went on to set fresh yearly highs. ETH marked a new 2020 high at $677 and reached the highest price since May 2018 amid Ethereum CME futures listing. Within 48 hours, ETH surged from lows of $580 to reach present highs of $677. ETH may be poised for a strong December as fundamentals and on-chain signal that the bullish move is not over yet, with ETH/USD bulls targetting $700. At the time of writing, Ethereum (ETH) is trading at $643, having gained over 3.5% daily and 14.0% weekly. Ethereum is currently second on the Coinmarketcap table, with a market cap of $73.37 billion and $25.55 billion in trade volume over the past 24 hours. The biggest US-based exchange for trading derivative instruments, CME announced the launch of Ethereum’s futures contracts for February 8, 2021, to cater to ‘client demand’.
*ETH marked a new 2020 record high at $677 and reached the highest price since May 2018
*At the time of writing, Ethereum (ETH) is exchanging hands at $643, having gained over 3.5% daily and 14.0% weekly
*CME announced the launch of Ethereum’s futures contracts for February 8, 2021
Key Levels
Resistance Levels: $750, $700, $680
Support Levels: $535, $480, $450
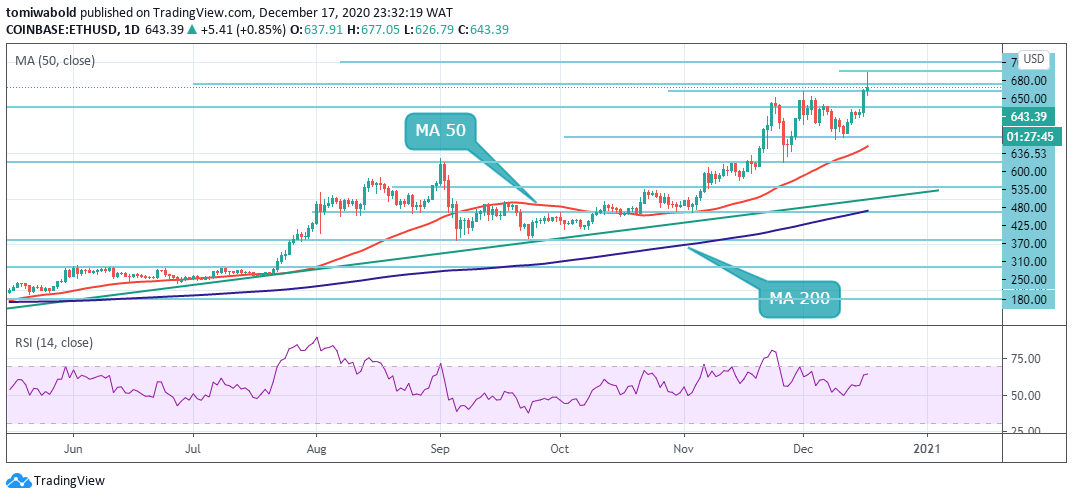 ETH/USD Daily Chart
As seen on the daily chart, the ETH price is in the bulls’ territory. In a further move, the next target of $700 may be attained, although the bulls may encounter subtle resistance at $680. The upsloping MAs and the RSI above midline signal that the path of least resistance is to the upside. A sustained move past $700 will cause a test of $720 and $750 levels.
On the flip side, if the price turns down from the present levels or fails to break past the $700 resistance zone, the first anchor may be envisaged at $636 which was flipped into support. If it fails to hold, supports could be seen at $535, and the MA 50 close at $516. A further downside attempt will bring the $480 support into the picture from where the price may rebound.
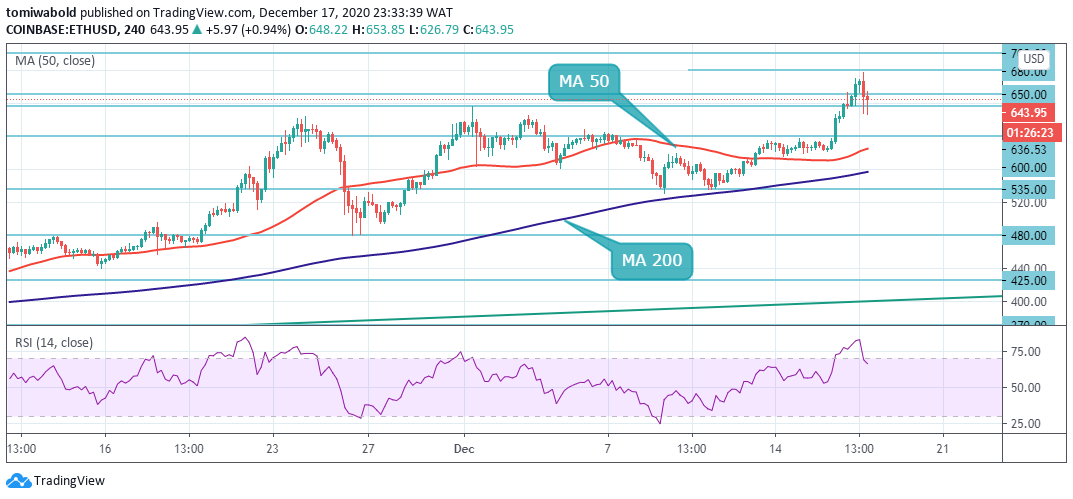 ETH/USD 4-Hour Chart
ETH bulls slowed down on the approach to $680 near term resistance. A close above $650 may signal that ETH’s bullish outlook remains. On the upside, a sustained break above $700 will kickstart the journey to $800. On the downside, the critical support comes at $580 which coincides with the 4 hour MA 50 close. The immediate bullish outlook will be invalidated if ETH plunges beneath this region.
In this scenario, ETH may be forced to seek the next buyer congestion zone at $555 where the MA 200 is situated. The ETH/USD pair is only bullish while trading beyond the $535 level around the MA 200, key resistance is found at the $680 and the $700 levels. If the ETH/USD pair trades beneath the $535, sellers may test the $480 and $425 prior support cluster.
Note: Kryptomoney.com is not a financial advisor. Do your research before investing your funds in any financial asset or presented product or event. We are not responsible for your investing results
Image Credit: Shutterstock


Keep in mind that we may receive commissions when you click our links and make purchases. However, this does not impact our reviews and comparisons. We try our best to keep things fair and balanced, in order to help you make the best choice for you.
