
Ethereum price has been under intense pressure lately. After soaring to an all-time high of $2,041 on Feb. 19, ETH embarked on a steady decline till it reached lows of $1,356. This price drop of nearly 33.5% coincided with a widespread market correction. ETH/USD bulls however bought the dip on Feb. 23 and Ethereum began its journey to recovery. At the time of writing, Ethereum is exchanging hands at $1,633, marginally up by 0.05% in the last 24 hours and 12.60% down on a 7-day basis. ETH/USD is presently consolidating its rebound while aiming for a higher breakout. Ranking 2nd largest by market cap, Ethereum’s market valuation now stands at $188.15 billion with a trading volume of $25.17 billion in the past 24 hours. Ethereum usage is on the rise with the value of transactions settled on the network so far, jumping by 700% than that of Q1 2020. Messari Research puts the present value of transactions settled in Q1 2021 on the Ethereum network at $926 trillion worth.
*ETH embarked on a steady decline till it reached lows of $1,356
*Ethereum is exchanging hands at $1,633, marginally up by 0.05% in the last 24 hours and 12.60% down on a 7-day basis
*Messari Research puts the present value of transactions settled in Q1 2021 on the Ethereum network at $926 trillion worth
Key Levels
Resistance Levels: $2,041, $1,800, $1,660
Support Levels: $1,550, $1,350, $1,200
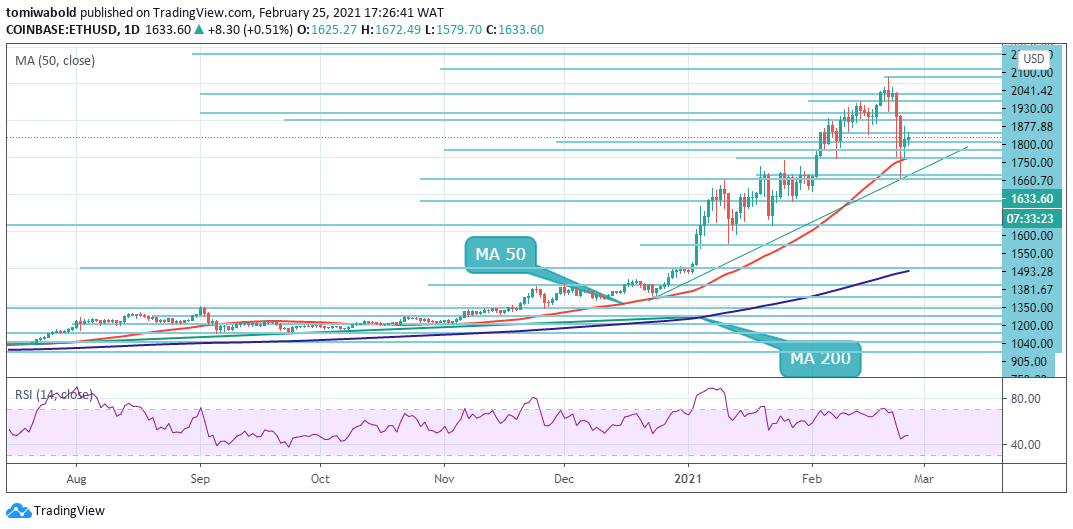 ETH/USD Daily Chart
Ethereum (ETH) fell beneath the MA 50 support at $1,500 on Feb. 22, however, the selling pressure was curtailed at $1,356 low coinciding with the ascending trendline support. The bulls managed to push ETH price to intraday highs of $1,714 on Feb. 24 before the bears defended this resistance. Support from the broader market would be needed for Ethereum to breakout of Tuesday’s high $1,714.
In this case, Ethereum may retest highs at $1,783 and then $2,041. On the contrary, the RSI slightly below the midline may suggest that the bears are trying to make a comeback. If the price turns down from current levels, the bears will once again try to pull and sustain the pair below the MA 50. If this happens, the ETH/USD pair may revisit support at $1,356 while a deeper correction may ensue to $1,000.
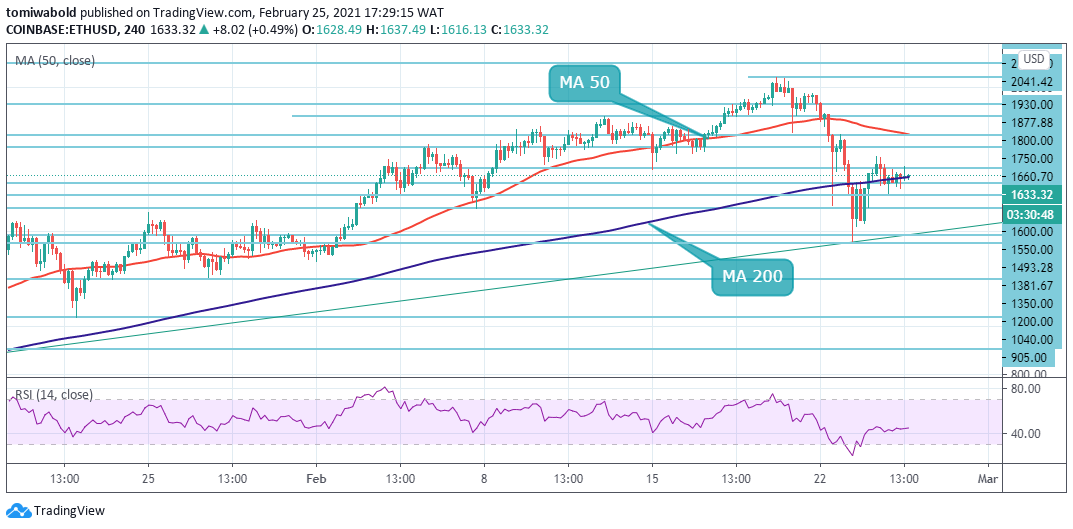 ETH/USD 4-Hour Chart
Ethereum lost the 4 hour MA 50 support on Feb. 22 while it traded briefly under the MA 200 before rebounding. ETH/USD price continues to hover around its MA 200 while awaiting a clear breakout. The immediate resistance at $1,660 must first be surmounted by the bulls for ETH to trend higher. If they succeed, the ETH/USD pair may again try to rise past $1,714 to reach past $1,889 marks in a bid to conquer the MA 50 support turned resistance.
Conversely, If the price again turns down from the MA 200, the ETH/USD pair could drop to the ascending trendline support. This is important to keep an eye on as a breach beneath this support could intensify the selling and drag the price down to $1,000. The ETH/USD pair is only bullish while trading above $1,630, at the MA 200, key resistance is found at the $1,800 and $2,041 levels.
Note: Kryptomoney.com is not a financial advisor. Do your research before investing your funds in any financial asset or presented product or event. We are not responsible for your investing results
Image Credit: Shutterstock


Keep in mind that we may receive commissions when you click our links and make purchases. However, this does not impact our reviews and comparisons. We try our best to keep things fair and balanced, in order to help you make the best choice for you.