
Ethereum is the among the best top 3 tokens at this time and recovers some of the ground lost in recent weeks. As the week comes to an end, and on Friday, we are seeing some modest rebound despite recent sell-off by the primary crypto board protectors. Ethereum price is slightly in the green after diving to the support at $370 earlier in the week. The price is eyeing highs as ETH/USD holds bullish impulse under $400. The crypto asset is currently second on the Coinmarketcap table, with a market cap of $44.46 billion and $9.25 billion in trade volume over the past 24 hours. At the time of writing, Ethereum is trading up just over 3% at its current price of $395 amid expanding volatility supported by the bullish case. There are now more than 1M ETH Testnet validating on the new Proof of Stake (PoS) blockchain. The number of validators has also risen to above 35,000, each of which requires 32 ETH. This makes it a full recovery for the Testnet and a continuation of its operations to refine the network for an expected live launch this November.
*Ethereum price is slightly in the green after diving to the support at $370 earlier in the week
*The price is eyeing highs as ETH/USD holds bullish impulse under $400
*There are now more than 1M ETH Testnet validating on the new Proof of Stake (PoS) blockchain
Key Levels
Resistance Levels: $500, $450, $400
Support Levels: $370, $300, $253
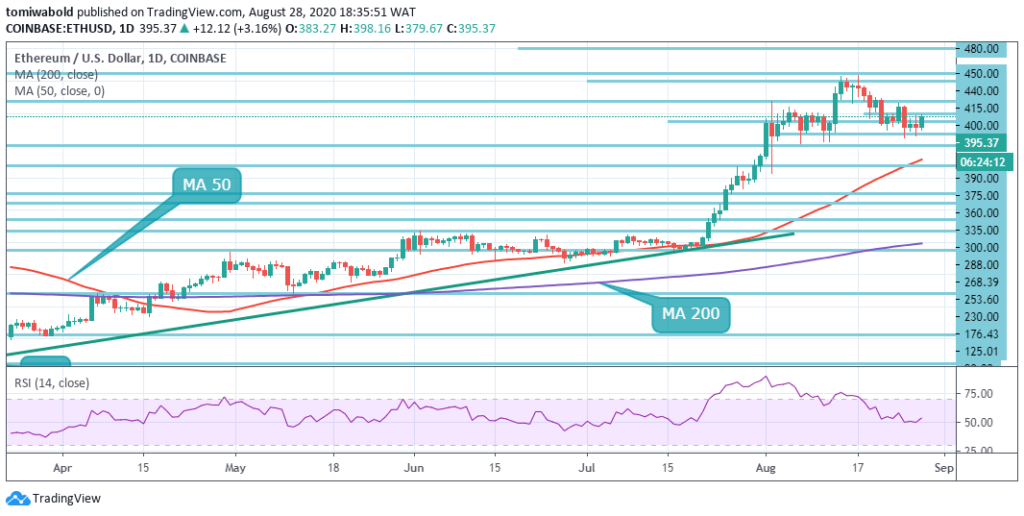 ETH/USD Daily Chart
Ethereum has spent the whole week struggling to stay beyond $400, as observed on the daily. Despite the bulls’ attempts, nevertheless, the second-largest cryptocurrency plummeted twice this week to $370. The first rebound heightened ETH/USD sharply to $411. As such, this major price action was, for the most part, was short-lived due to the absence of adequate volume.
Steadily increasing selling activities have taken place, pushing Ethereum not only beneath $400 but back to $370. In the upcoming sessions (including the weekend) Ethereum may stay in consolidation as per the prevalent technical context. Huge growth over $400 is up for the next week’s forecasts. Considering the RSI and the MA 50 distance versus the MA 200 makes logical sense.
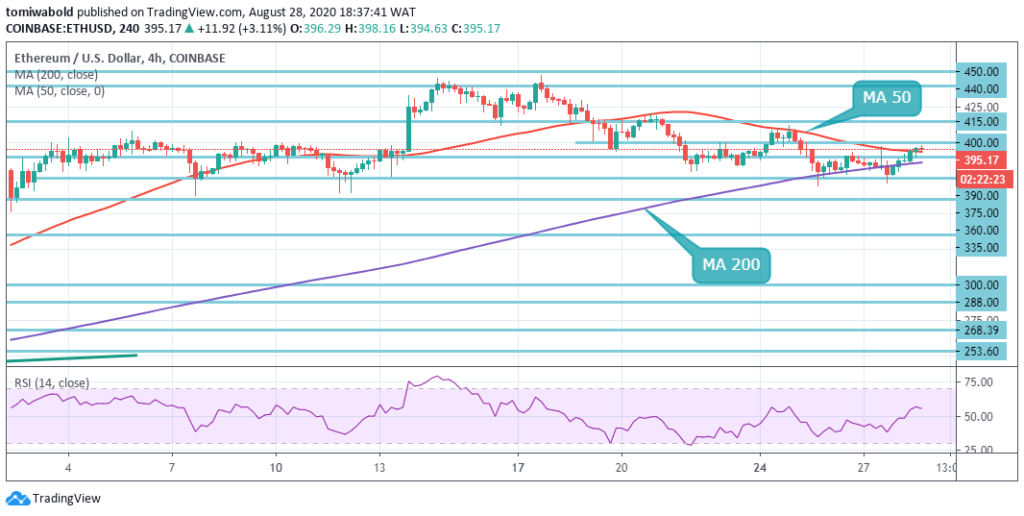 ETH/USD 4-Hour Chart
The indicators tend to be sending mixed signals within the 4-hour range. For example, the RSI appears to be leaning towards the midline which means that in the short term, ETH may embrace consolidation. The 4 hours MA 50 and the MA 200, on the other hand, indicate a closing of the gap between the lines which implies an anticipated bearish turn. Besides, the indicator features a bearish divergence, further cementing sellers’ control over the market.
Ethereum is under pressure to sell, as the second-largest cryptocurrency exchanges around the $390.00 support range. Technical analysis suggests that over the lower time frame a broad pattern of the head and shoulders has evolved. A breakout beneath the level of $370 may trigger the pair of ETH/USD to sink towards the level of $300, and probably the level of $253.
Note: Kryptomoney.com is not a financial advisor. Do your research before investing your funds in any financial asset or presented product or event. We are not responsible for your investing results
Image Credit: Shutterstock


Keep in mind that we may receive commissions when you click our links and make purchases. However, this does not impact our reviews and comparisons. We try our best to keep things fair and balanced, in order to help you make the best choice for you.
