
The cryptocurrency market began a gradual recovery from the prior two days sell-off, with most cryptocurrencies trading green again on a 24-hour basis. On December 17, Ethereum (ETH) rallied to $677, its highest level since May 2018 but the price failed to hold above this level. In a strong rejection at the December 20 high of $661, Ethereum started a downward move similar to Bitcoin. Following a sell-off that saw Ethereum print two red daily closes, ETH/USD rebounds from $587 lows to trade at an intraday high of $634. Solid fundamentals and positive newsflow coupled with BTC recovery seem to be attributable to ETH rebound past $600. At the time of writing, Ethereum (ETH) is trading at $624, having gained over 3.00% daily and 7.5% weekly. Ethereum scalability may be set to improve through the ‘L2 Squared’alliance of DEXs, DeversiFi, and Loopring partner. In a recent announcement, the alliance wants to ease the transition for users into these higher performance on-chain exchanges. The alliance dedicated to promoting the usage of layer two solutions comes as the Ethereum roadmap formally incorporated a rollup-centric vision.
*In a strong rejection at December 20 high of $661, Ethereum started a downward move
*ETH/USD rebounds from $587 lows to trade at an intraday high of $634
*Ethereum scalability may be set to improve through ‘L2 Squared’alliance of DEXs, DeversiFi, and Loopring partner
Key Levels
Resistance Levels: $750, $700, $680
Support Levels: $535, $480, $450
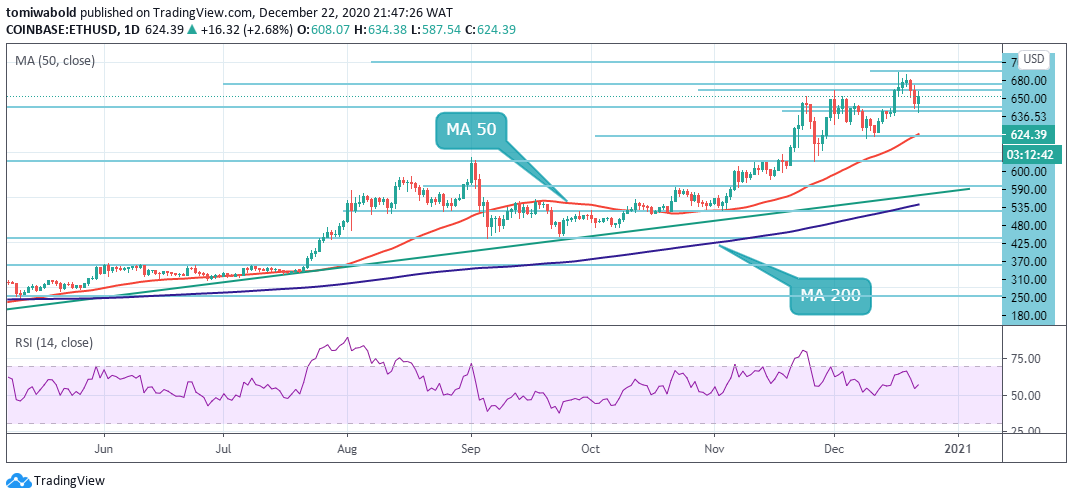 ETH/USD Daily Chart
ETH/USD price slipped to intraday lows of $587 where the bulls stepped in to show solidarity. ETH consequently went on to set intraday highs of $634. Ahead of this level, the first major resistance level at $650 may likely cap any upside. In the event of an extended rally, Ethereum may test a resistance zone between $650 -$677.
A break above $677 may bring the pattern target of $700 back into play. On the flip side, if the price turns down from current levels, ETH may decline to the $600 pivot. Another key support is seen at the $590 level where the recent rebound occurred. A close below the $590 level might open the doors for a larger decline towards the $580 and $575 marks.
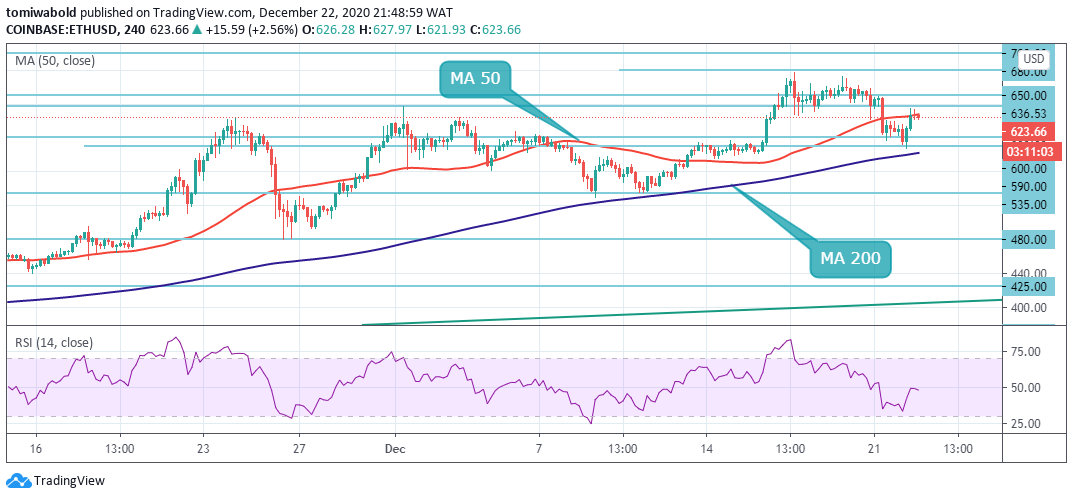 ETH/USD 4-Hour Chart
ETH reclaimed the 4-hour MA 50 resistance at $626 subsequently in its rebound. ETH price should settle above the MA 50 level past $600 to retain long term bullish bias. A breakdown below this point may push ETH price towards the MA 200 close. An extended decline below the MA 200 at $590 may invalidate the bullish outlook.
On the upside, if ETH sustains its run past $626, ETH may retest its recent high of $677 and then $700. In the long-run, ETH has the potential to hit $800. The ETH/USD pair is only bullish while trading beyond the $535 level around the MA 200, key resistance is found at the $680 and the $700 levels. If the ETH/USD pair trades beneath the $535, sellers may test the $480 and $425 prior support cluster.
Note: Kryptomoney.com is not a financial advisor. Do your research before investing your funds in any financial asset or presented product or event. We are not responsible for your investing results
Image Credit: Shutterstock


Keep in mind that we may receive commissions when you click our links and make purchases. However, this does not impact our reviews and comparisons. We try our best to keep things fair and balanced, in order to help you make the best choice for you.