
Ethereum’s price failed to breakout higher after consolidating between $4,200 and $3,700 levels recently. As a result, the ETH/USD is retracing to the next crucial support levels while heading lower on Friday. Ether and crypto market sentiment deteriorated on concerns about a new coronavirus wave that could lead to harsh restrictions in an attempt to curb the spread rising. After the market first rallied on talks of inflation, we now see concerns about what virus spread could mean for the overall cryptocurrency markets. ETH price traded lower reaching an intraday low of $3,700 despite pushing for some recovery today. At the time of writing this analysis, the Crypto Fear & Greed Index is still in the Extreme Fear zone at 23 points as ETH/USD hovers at $3,900. The Ethereum dominance index increased to 21.2%, gaining more “territory” from Bitcoin, whose market share fell to 40.6% in 2021. At the start of the year, BTC had a market cap of 71.86 percent, while ETH had a market cap of 10.63 percent.
Key Levels
Resistance Levels: $4,500, 4,250, $4,000
Support Levels: $3,700, $3,500, $3,270
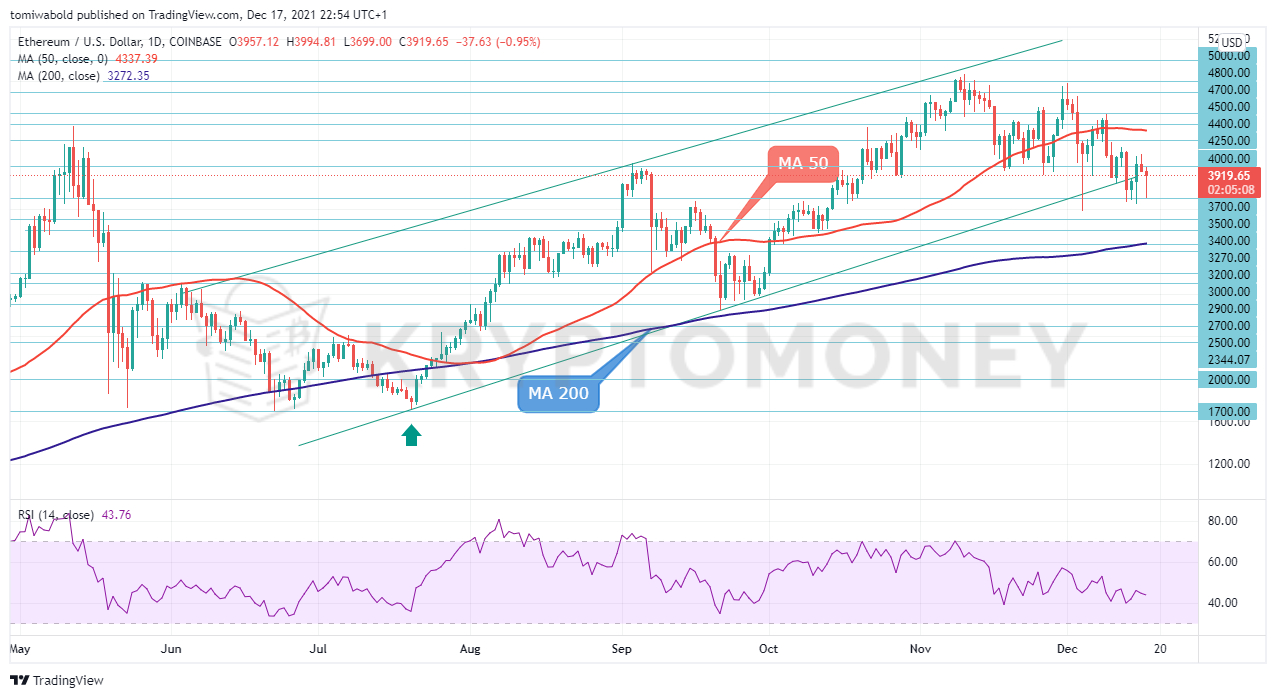 ETH/USD Daily Chart
ETH/USD attempted to return to its all-time high of $4,861 on Dec. 1, but its efforts proved fruitless, with the price drifting lower to bounce around the $3,575 level. Since the declines, ETH has struggled to offset bearish pressures. Although the decline appears to have ended above the moving average (MA 200), the pair has been trading sideways in a set range.
Of note, the daily relative strength index (RSI) has been moving against the market direction over the start of the month, making lower highs. It reminds of a bearish divergence, a warning that the bulls are running out of fuel. Nevertheless, if the pair manages to set a foothold around the $4,000 level the bulls may try to push higher.
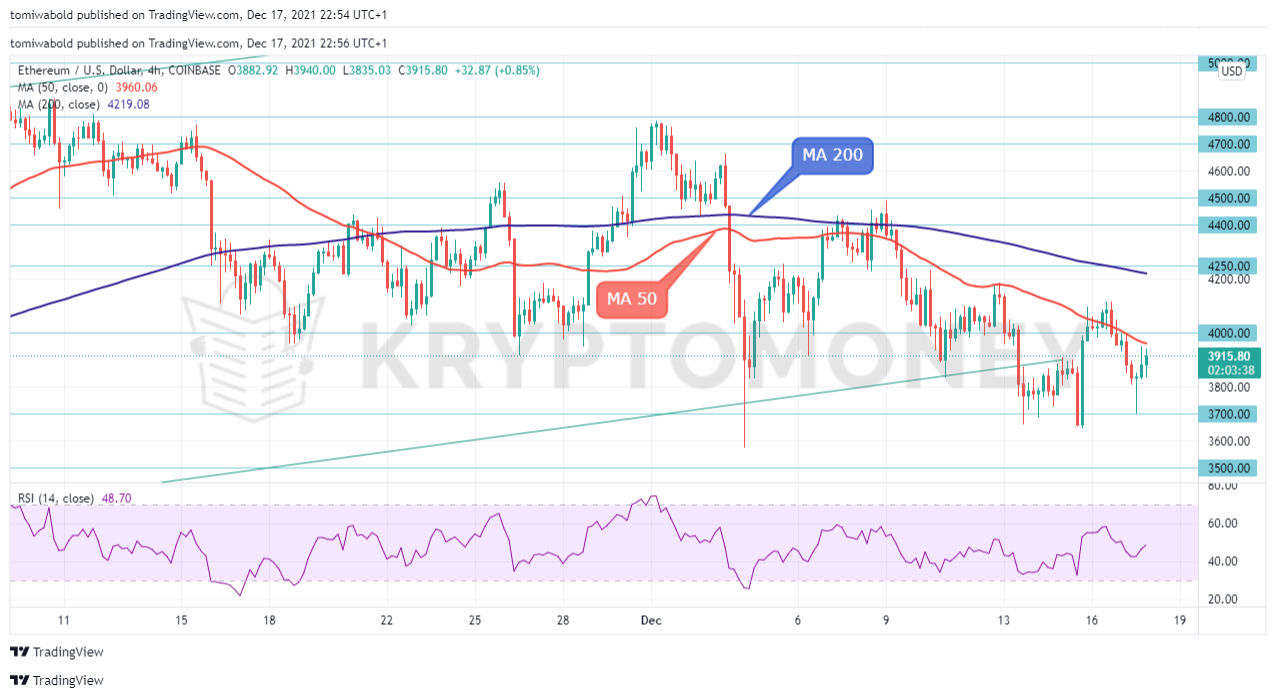 ETH/USD 4-Hour Chart
The short-term outlook for ETH/USD is looking cloudy at the moment. Unless the price corrects above the $4,000 level and 4-hour moving average (MA 50), sellers could keep the upper hand. Meanwhile, the pair could sustain its support at $3,700, without reaching the next closest support zone at $3,500.
The sellers’ struggle to push lower and the buyers’ attempts above $3,700 suggest that the mood could be improving. Price action remains within a consolidation range above low of $3,575 lacking a clearer direction signal, as the outlook stays mixed. Although ETH has seen support over the flash crash 14 days ago, it could be a key level for ETH as it looks to find its groove again.
Note: Kryptomoney.com is not a financial advisor. Do your research before investing your funds in any financial asset or presented product or event. We are not responsible for your investing results
Image Credit: Shutterstock


Keep in mind that we may receive commissions when you click our links and make purchases. However, this does not impact our reviews and comparisons. We try our best to keep things fair and balanced, in order to help you make the best choice for you.