Ethereum (ETH) was hit heavily by bears in the week following the surprising implosion of the FTX exchange. At press time, ETH traded at $1,256, marginally up in the last 24 hours, per CoinMarketCap data. Despite the price decline, in the last four days alone, more than 13,000 ETH have been burned. A mechanism to burn a portion of user fees was introduced in August last year via the Ethereum Improvement Proposal (EIP)-1559. In essence, the EIP links network usage and the amount of ETH burned. The recent rise in network activity may have been caused by the market instability brought on by the collapse of the cryptocurrency exchange FTX. The annualized inflation rate for ether (ETH) also decreased to 0.029%, indicating that more has been burned than has been created. Once the fear caused by FTX has subsided, the favorable adjustment to Ether’s tokenomics might help the cryptocurrency outperform Bitcoin and the larger market.
Key Levels
Resistance Levels: $1,700, $1,500, $1,300
Support Levels: $1,200, $1,000, $800
 ETH/USD Daily Chart
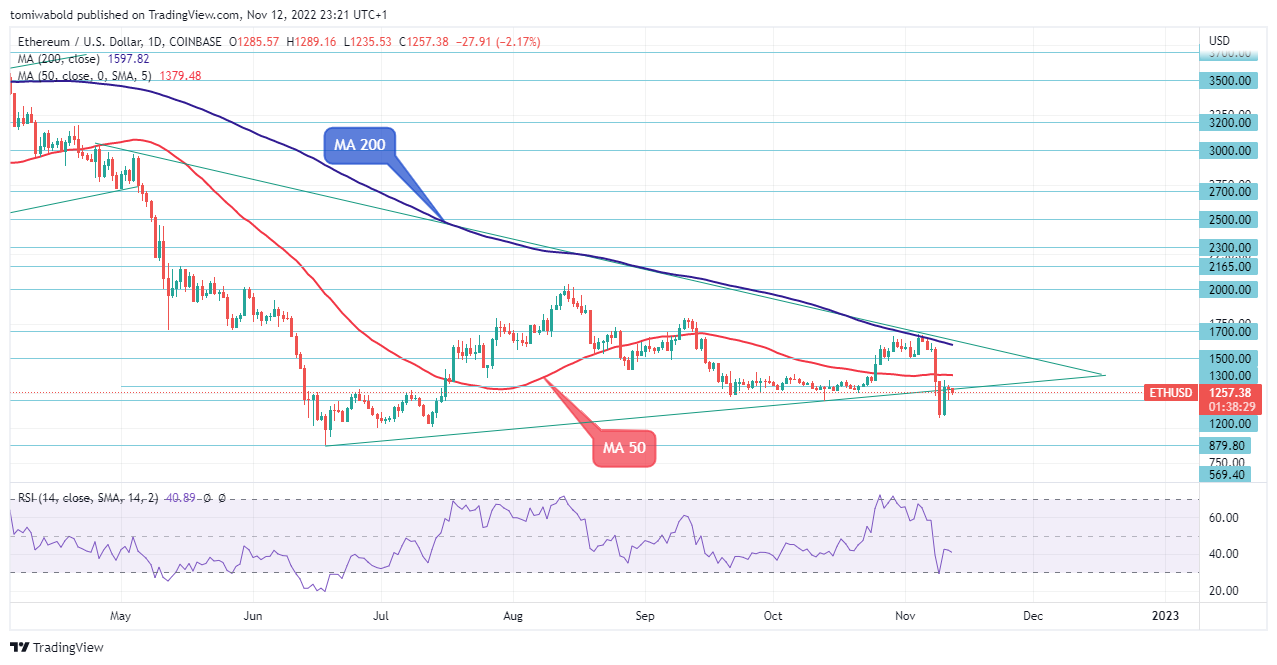
ETH price has been in recovery mode since November 9th, gradually erasing the slide to a three-month low of $1,071, launching the price out of the $1,000-$1,200 region. After reaching intraday highs of $1,289, the ETH/USD pair is currently attempting to extend its upward momentum above the MA 200 ($0.067), with the RSI supporting a new push as the indicator is sloping upwards again after striking a bottom in the oversold area.
However, at the $1,000 level, a past support region, it proved to be a difficult obstacle to pass on Thursday. Meanwhile, if the bulls take the $1,300 handles, they may need to break over the MA 50 ($1,380) to confront the important $1,500–$2,000 resistance region. In addition, if sellers push ETH prices below $1,000, the recent November 9 low of $1,071 may be tested again.
 ETH/USD 4-Hour Chart
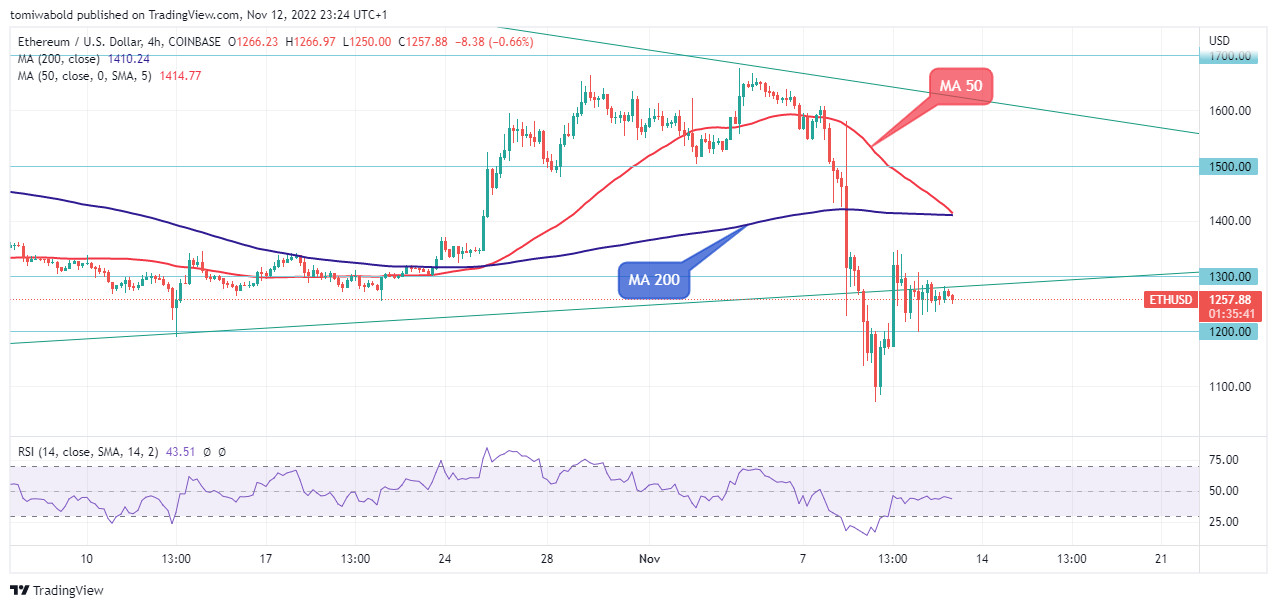
ETH/USD steadied around the $1,300 price level before falling below and establishing some footing at the Nov. 9 support lows of $1,071. ETH was trading near the 4-hour MA (50) at the time of writing. The 4-hour RSI is below 50, indicating neutral-bullish price activity. If sellers are successful in sending ETH far below the MA 50 at $1,200, early support from the $1,100 level could emerge before the bears test the recent floor at $1.071.
Otherwise, if buyers are successful in driving the price over a cluster of resistance above the $1,500 level to the next price level at $1,700, the $2,000 barrier may attempt to offset the buyers’ efforts to improve. The bulls would then have to endure and then break through the $2,000-$2,200 resistance level.
Note: Kryptomoney.com is not a financial advisor. Do your research before investing your funds in any financial asset or presented product or event. We are not responsible for your investing results
Image Credit: Shutterstock
Keep in mind that we may receive commissions when you click our links and make purchases. However, this does not impact our reviews and comparisons. We try our best to keep things fair and balanced, in order to help you make the best choice for you.