
The cryptocurrency market swooned at the start of the trading week but managed to limit losses afterward. The no.2 largest crypto has had a successful swing from $1,700 lows in July to a monthly high of $3,378 in August. In the near term, the trend seems to have shifted with Ethereum currently under heavy selling pressure at $3,350, preventing it from surging over previous highs. However, ETH refused to close below the psychological level of $3,000 in the daily chart and the supportive trendline, raising optimism that the upward pattern could see further continuation. ETH/USD finds support at $3,056 during the Thursday session, following a bruising sell-off over the entire cryptocurrency market overnight. At the time of this post, ETH/USD was trading at $3,103 after a drop from a $3,251 intraday high. The recent price movement was sparked by Whales intervention talks that $500M in Ethereum moved on Tuesday and Wednesday in 13 distinct transactions. In addition, Ethereum options traders are closely watching the expiration of $820 million monthly options on Friday, Aug. 27.
Key Levels
Resistance Levels: $3,700, $3,500, $3,350
Support Levels: $3,000, $2,700, $2,500
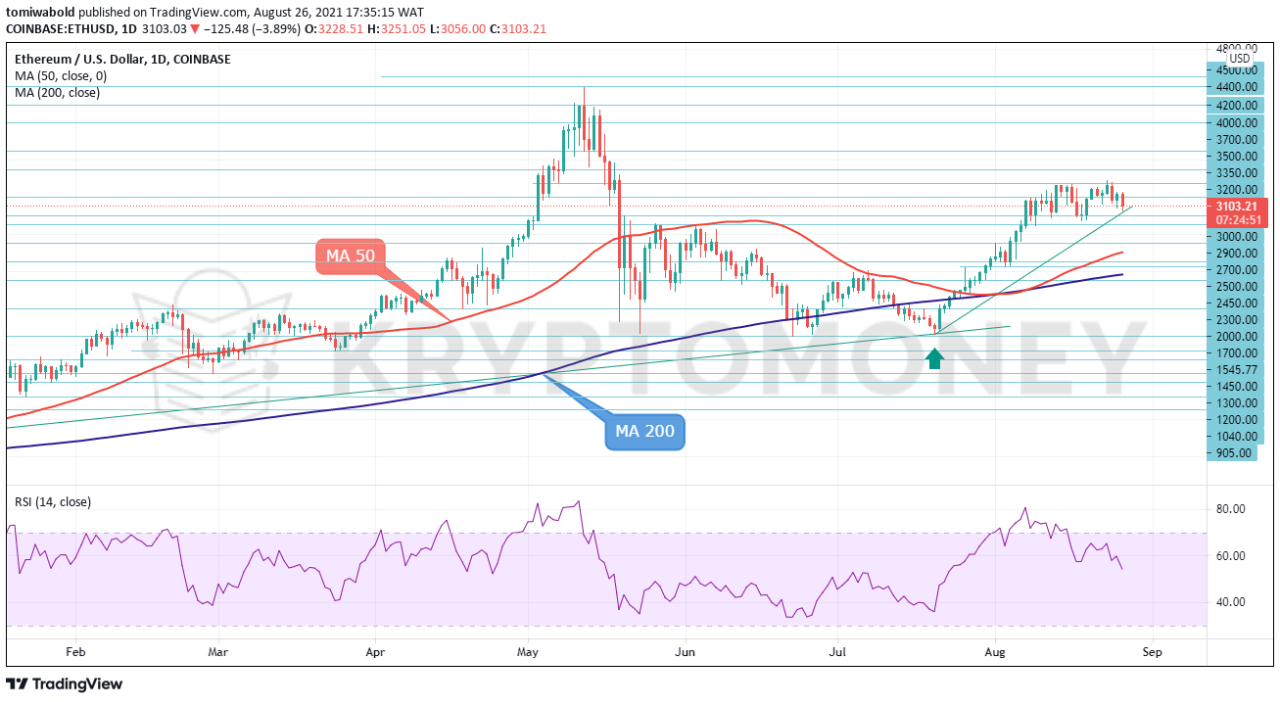 ETH/USD Daily Chart
The ETH/USD pair is struggling to maintain its positive momentum after meeting resistance in the $3,378 area. Nevertheless, the rebound from Thursday’s one-week low of $3,056 appears to stall prices testing below the Psychological level 0f $3,000. To validate a bullish reversal, we still need that push and daily closure out of a negative turn beyond $3,200.
Looking at the momentum indicators, the daily moving averages (MA 50 & MA 200) are still rising but the Relative Strength Index appears to have peaked within the overbought zone, and now shifting into a weakening bias in the medium term below line 60. If today’s selloff accelerates, the price could seek support from the next level at $2,900.
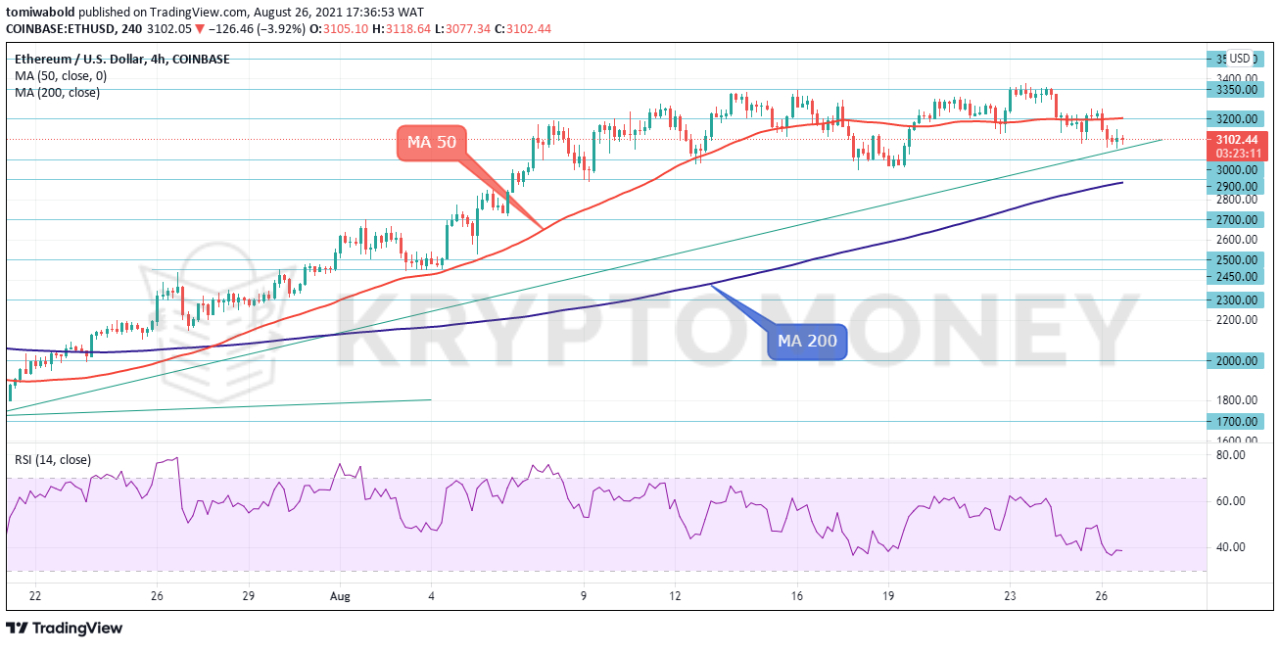 ETH/USD 4-Hour Chart
The fading bullish momentum on the lower time frame of the 4-hour chart warns of a recovery stall as the moving average (MA 50) set up around $3,200 stays on track to limit ETH/USD advance in the near term. The $3,200 level is the nearest barrier, which the bulls need to successfully overcome to rally towards the previous peak of $3,378.
On the downside, a step below the trendline could find immediate support near its 4-hour moving average (MA 200). On the breach of the support, the $2,700 handle could be the next pivot point if selling forces persist. All in all, ETH/USD is still looking neutral in the very short-term picture. A close above $3,200 could confirm additional upside corrections.
Note: Kryptomoney.com is not a financial advisor. Do your research before investing your funds in any financial asset or presented product or event. We are not responsible for your investing results
Image Credit: Shutterstock


Keep in mind that we may receive commissions when you click our links and make purchases. However, this does not impact our reviews and comparisons. We try our best to keep things fair and balanced, in order to help you make the best choice for you.


