
Since last week’s sessions, the Ethereum coin has risen by approx 35 percent against the US dollar. All things considered, the exchange rate over the subsequent trading sessions may likely stay bullish. Ethereum is the second-largest digital asset with a total of $43.4 billion in market capitalization and an estimated $11 billion in daily trading volume. Having regained from $90 on March 13 to over $415 on August 2, Ethereum is one of the best-performing coins in recent times. Following an enormous rise past $400 mark on ETH/USD, the ongoing technical correction seeks support at $375 and lower. ETH/USD is trading at $386 at the time of publishing, with sights on $400 level. The spike in on-chain activity in Ethereum with a positive ripple effect stems from the rise in crypto-currency prices particularly for Ethereum. The rise was due to decentralized apps (dApps) and blockchain casinos.
*Having regained from $90 on March 13 to over $415 on August 2 Ethereum is one of the best-performing coins in recent times
*Following an enormous rise past $400 mark on ETH/USD the ongoing technical correction seeks support at $375 and lower
*The spike in on-chain activity in Ethereum with a positive ripple effect stems from the rise in crypto-currency prices particularly for Ethereum
Key Levels
Resistance Levels: $450, $435, $415
Support Levels: $375, $360, $335
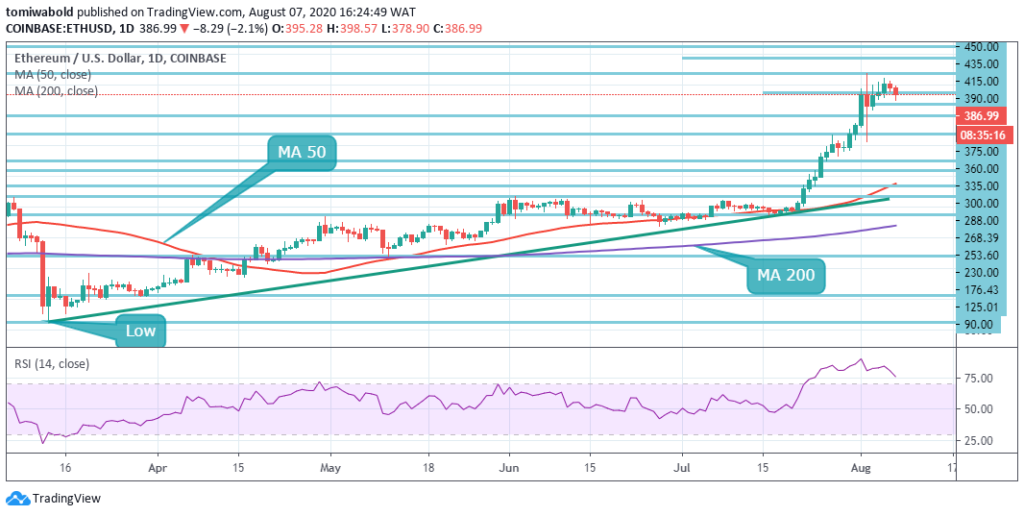 ETH/USD Daily Chart
A few days after trading fresh yearly highs at $415, ETH price appears to be settling for correction. Its $375 support may hold for a short while, but profit-taking buyers are equipping the bears and that may keep forcing ETH to $360 for the next support. The daily chart depicts the RSI bearing healthily beyond 75. Since late July, the indicator has been overbought. Following an enormous rise past $400 mark on ETH/USD the ongoing technical correction seeks support at $375 and lower.
The MA 50 reveals on the positive side that buyers have an upper hand whilst switching upwards. The MA 200 is now slowly moving upward, in addition to having a positive outlook. This suggests Ether is in the bulls’ hands even though it lacks a boost and the liquidity to extend progress to $450 next key resistance level.
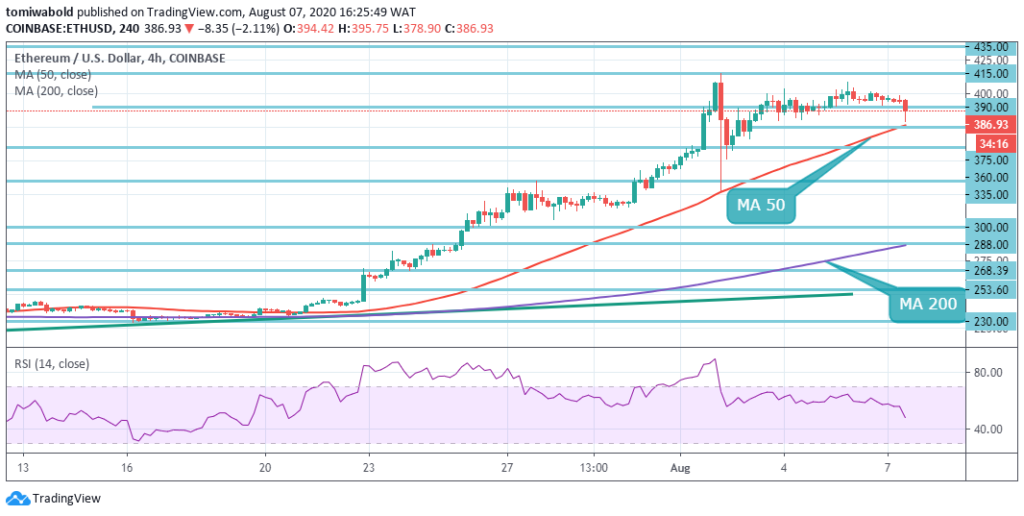 ETH/USD 4-Hour Chart
Ethereum has begun posting its initial bearish session on the 4-hour chart in August after its correction set in from the recent $415 high. The 4 hour MA 50 is out to restrict the bears’ activity around the $375 zone. If violated, the local support is established by horizontal support of $360 on its downside. A persistent push lower may raise the selling pressure and send the price to $335 level.
Furthermore, the ETH/USD pair has a consistent short-term trade bias once the price is beyond the support level of $360. The ETH/USD pair is only bullish while trading beyond the level of $335, the main resistance is seen at the level of $415, and $435. Sellers may test the $335 and $300 levels once the ETH/USD pair exchanges beneath the $360 level.
Note: Kryptomoney.com is not a financial advisor. Do your research before investing your funds in any financial asset or presented product or event. We are not responsible for your investing results
Image Credit: Shutterstock


Keep in mind that we may receive commissions when you click our links and make purchases. However, this does not impact our reviews and comparisons. We try our best to keep things fair and balanced, in order to help you make the best choice for you.