
The consolidation process initiated in the crypto market at the end of last week is ongoing, and the sentiment on the correction that dominated the market is easing. However, Bitcoin continues to be the big beneficiary of the downward movement as Ethereum (ETH) exhibits signs of recovering market share in the short term. Ethereum price peaked at $447.50 before an extended consolidation period that had ETH dip below the 4 hour MA 50 and $400 shortly. Buyers managed to activate a fresh potential rally as ETH/USD bounces off the $400 threshold. The crypto asset is currently second on the Coinmarketcap table, at $46.72 billion, with $10.26 billion traded in the past 24 hours. At the time of writing, Ethereum is cautiously consolidating in a bullish control zone above the $400 level of support. Tether has transferred $1 billion in USDT from the TRON blockchain to Ethereum. The chain swap comes as the booming DeFi market pushes Ethereum and many ERC20 tokens higher in the quest of yield-seeking investors.
*Ethereum price peaked at $447.50 before an extended consolidation period that had ETH dip below the 4 hour MA 50 and $400 shortly
*Buyers managed to activate a fresh potential rally as ETH/USD bounces off the $400 threshold
*Tether has transferred $1 billion in USDT from the TRON blockchain to Ethereum
Key Levels
Resistance Levels: $510, $480, $450
Support Levels: $400, $360, $335
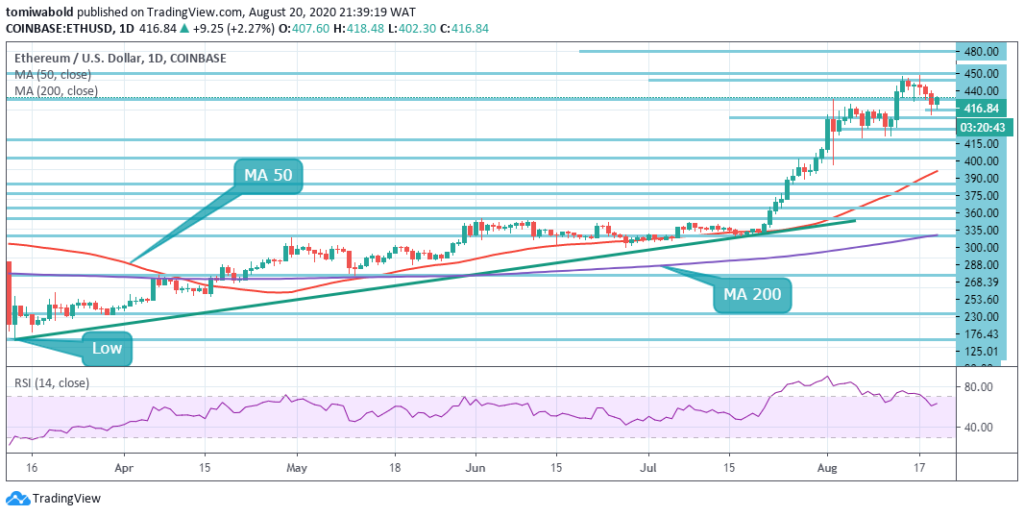 ETH/USD Daily Chart
ETH/USD has already made a shallow recovery above $400. However, the comeback above $400 is limited under $440. The daily chart brings into the picture a bearish pennant pattern that suggests that ETH may attempt moving beneath the $400 threshold. Bulls need to rally price initially and send the price beyond $440 resistance. This will shift attention back to $450 while averting the potential declines that eyes $360 on the downside.
For now, ETH seems to be slightly in the hands of the bulls and slightly in the hands of the bears. The RSI has held above the midline, encouraging buyers not to exit the market. On the flip side, the MA 50 is growing farther from the MA 200 suggesting need for correction. Moreover, a vivid bearish divergence from the RSI reinforces the bearish grip. Bulls must defend the support as if the pairs traction survives on it.
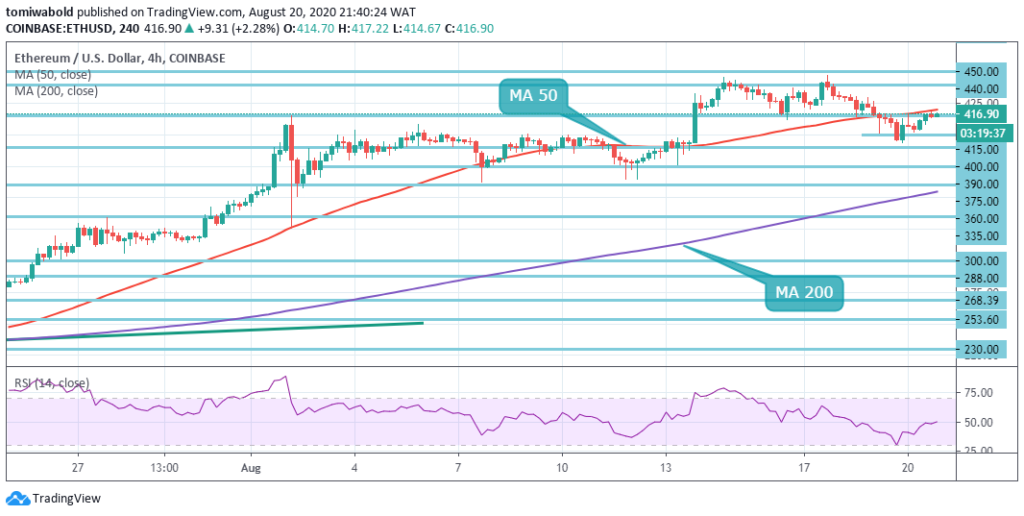 ETH/USD 4-Hour Chart
Technical analysis on the 4-hour chart implies that Ethereum is vulnerable to a slight downside correction after the cryptocurrency found meaningful resistance from the $450/$440.00 regions. ETH/USD could start to trade back under the $400.00 level if traders start to book profits and Bitcoin also corrects lower. To the upside, a sustained breakout above the $450.00 level is needed to encourage technical buying towards the $480.00 area.
Nonetheless, for now, the risk of Ethereum shifting into a downtrend is minimal. The 4 hour RSI has pulled off from a bearish position. The overall stance of Ethereum is still bullish in the short and medium-term. The ETH/USD pair is only bullish while trading above the $400.00 level, key resistance is found at the $450.00 and the $480.00 levels. If the ETH/USD pair trades below the $400.00, sellers may test the $390.00 and $360.00 support levels.
Note: Kryptomoney.com is not a financial advisor. Do your research before investing your funds in any financial asset or presented product or event. We are not responsible for your investing results
Image Credit: Shutterstock


Keep in mind that we may receive commissions when you click our links and make purchases. However, this does not impact our reviews and comparisons. We try our best to keep things fair and balanced, in order to help you make the best choice for you.
