
Almost a day after the selloff was sparked by holders profit-taking, the cryptocurrency market is still in a bloodbath. The Ethereum cryptocurrency had surged against the US Dollar registering new highs of $623 during its recent rally upwards. During its correction at the peak, an intense sell-off triggers on ETH/USD under $623 high to higher lows. An intraday resistance level for ETH/USD is present at $531 with a local support level intact at $488.95. The crypto asset is currently second on the Coinmarket cap table, with a market cap of $57.76 billion and $21.37 billion in trade volume over the past 24 hours. At the time of this analysis, ETH/USD seems poised for further losses under $500 while trading at $503.50. Despite the recent setbacks in price, the bullish market stays dominant for ETH. Ethereum 2.0 hits the 6th-largest PoS blockchain with the number of unique depositors exceeding 2,000, while the number of validators surpassed 21,000. This implies that the PoS has flipped well known rival PoS chains such as Tezos, Cosmos, and Polkadot.
*During its correction at the peak an intense sell-off triggers on ETH/USD under $623 high to higher lows
*An intraday resistance level for ETH/USD is present at $531 with a local support level intact at $488.95
*Ethereum 2.0 hits 6th-largest PoS blockchain with the number of unique depositors exceeding 2,000, while the number of validators surpassed 21,000
Key Levels
Resistance Levels: $623.13, $600.00, $580.00
Support Levels: $488.95, $450.00, $400.00
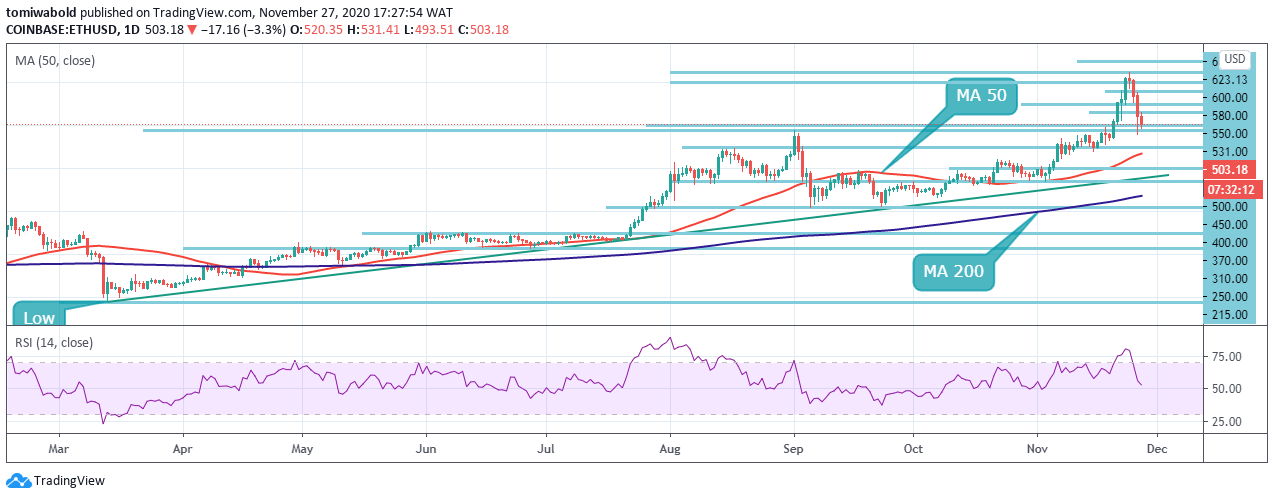 ETH/USD Daily Chart
On the ETH/USD daily charts, indicators such as RSI presented a sell signal and four red candlesticks that might transform into a further sell signal in the following sessions. A rejection came into the picture at the $623 high, forcing the king Altcoin back into the $500s territory. The nearest support level stays around the $488.95 to $450 region.
On the other hand, if the bearish pressure is not strong enough to retain a price under $500, the smart-contract giant might start a new upside surge. A sustainable move beyond the $550 level may renew the buying pressure and open up the way past $600, as the lower line of the prior consolidation channel at $450, reinforced by the daily MA 50 may halt further selling.
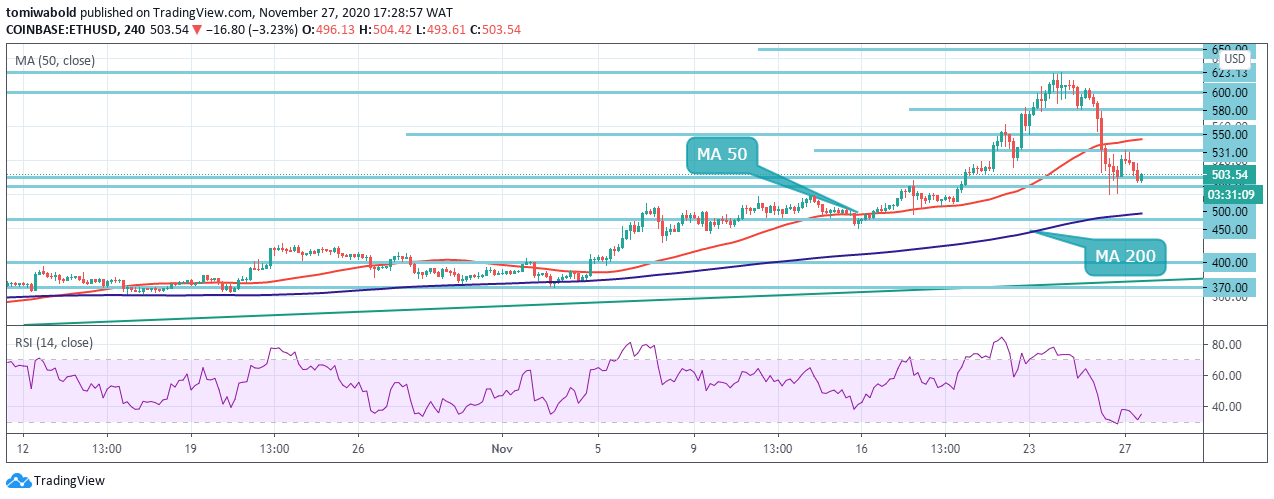 ETH/USD 4-Hour Chart
ETH/USD is correcting lower alongside BTC, while the pair attempts to recover prior heavy downside losses. The token may rebound from the $500 level after suffering a steep decline past the 4 hour MA 50 just below the $550 region. Technical analysis shows that the ETH/USD pair could bounce back towards the $650 area if the $580 near term resistance falls.
To the downside, a sustained breakout beneath the $488.95 level could see the ETH/USD pair testing back towards the 4 hour MA 200 zone and $450 level. The ETH/USD pair is only bullish while trading above the $550 level, while resistance is at the $580 and the $623 levels. If the ETH/USD pair trades below the $500 mark, sellers may test the $488.95 and $450 support levels.
Note: Kryptomoney.com is not a financial advisor. Do your research before investing your funds in any financial asset or presented product or event. We are not responsible for your investing results
Image Credit: Shutterstock


Keep in mind that we may receive commissions when you click our links and make purchases. However, this does not impact our reviews and comparisons. We try our best to keep things fair and balanced, in order to help you make the best choice for you.
