
After been isolated in a range for weeks, the technical breakout of ETH becomes inevitable. Hence the re-emerging of the bullish sentiment, although not entirely out of the woods, as it’s yet to return to key highs. So far an air of confidence has returned across the crypto markets past the sell-off. Ethereum’s rebound has performed significantly better than analysts were expecting. ETH printed green candles in 10 consecutive sessions as investors leave dips behind. Retail and institutional traders began to line up entry orders to buy what was thought to be the last major slump above $1,700 indicating that crypto traders will not witness a drop towards $1,000. At the time of this post, ETH/USD had hit a $2,484 intraday high, gaining 5% in 24hrs and nearly 14% weekly. The “Ethereum vs. the rest” narrative is changing as developers grasp the value of a cross-chain future rather than needing to choose one blockchain to build on, giving scalability with Ethereum-based protocols. As a result, Ethereum has a first-mover edge and, as of Q1 2021, is the most active blockchain in the DeFi ecosystem.
Key Levels
Resistance Levels: $3,500, $3,000, $2,500
Support Levels: $2,000, $1,500, $1,000
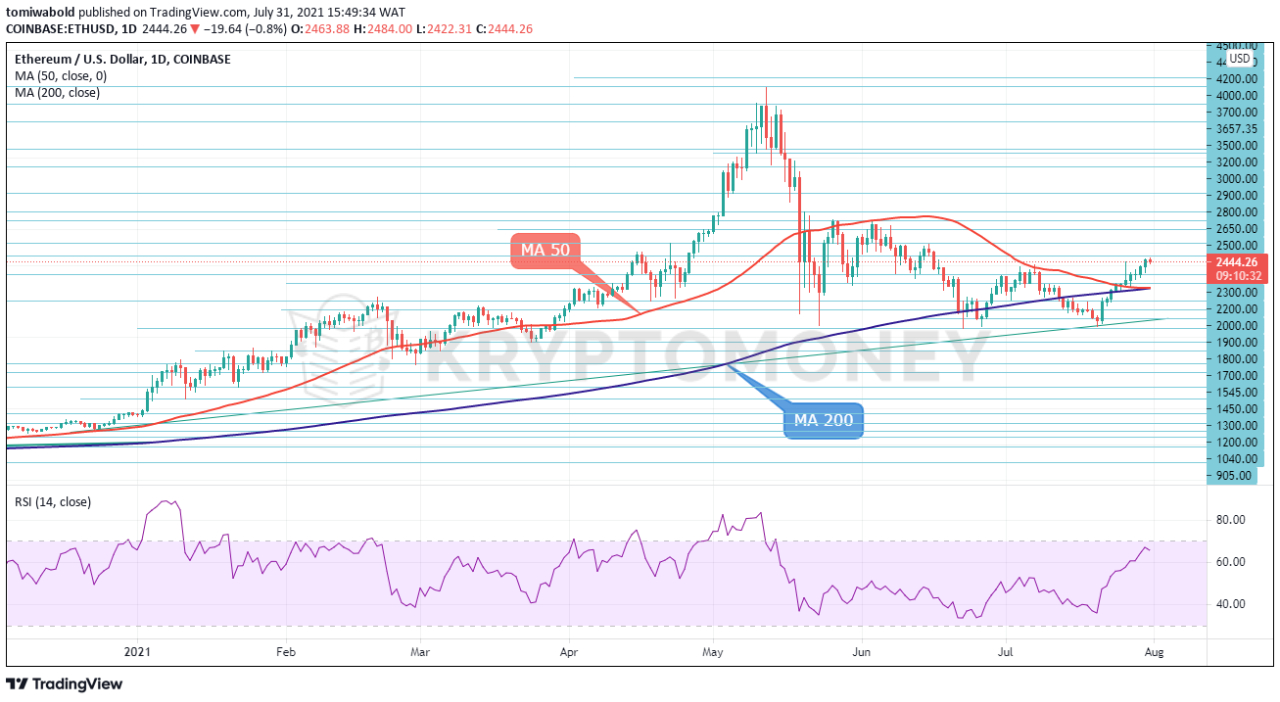 ETH/USD Daily Chart
The ETH/USD pair is trading above its important moving averages (MA 50 and MA 200) and seeking to break the key $2,500 resistance zone on the daily time frame. The RSI indicator is nearing overbought borders, but it is interesting to note that the RSI is not yet overbought. The upside barriers up from the $2,500 – $3,000 fought hard in limiting ETH/USD price.
A significant move above these lines would take the market to $3,500, followed by $4,383 an all-time high, before running into immediate resistance at $4,500. A bearish rollercoaster beneath the converging moving averages (MA 50 and MA 200) on the $2,150 level might push ETH prices to the June 2021 inside swing low of $1,700 and below.
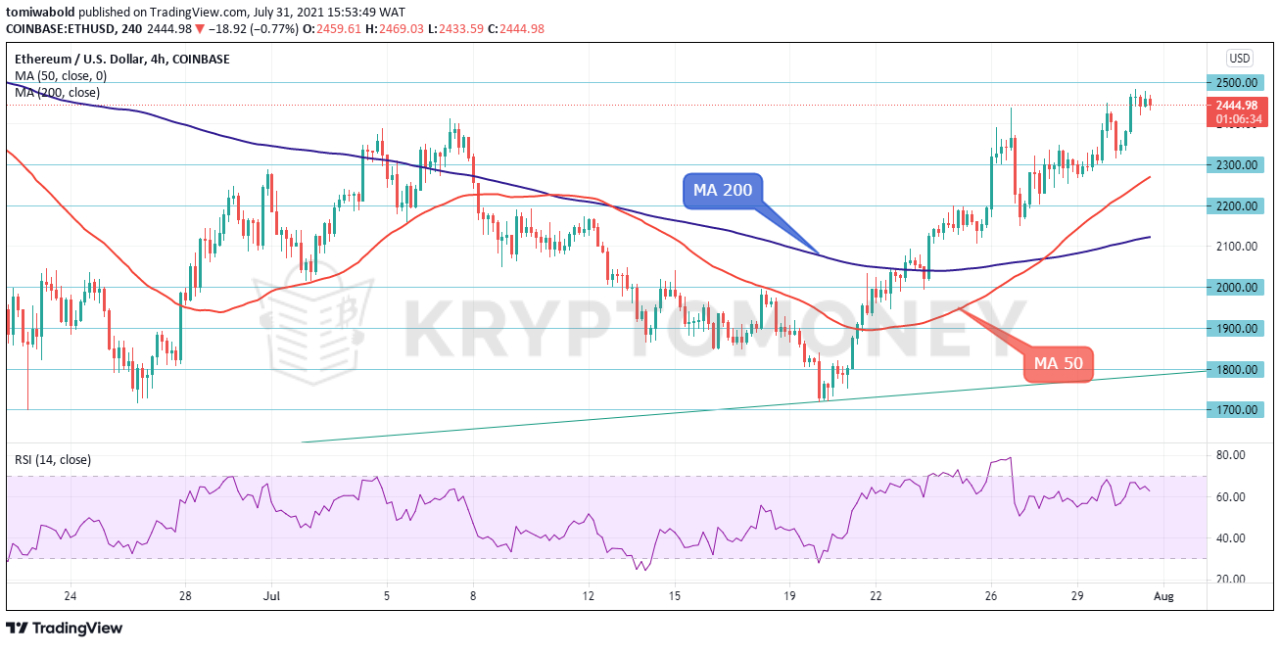 ETH/USD 4-Hour Chart
On the 4-hour time frame, On July 23, the $2,000 price level was held as support. Following that, the ETH price climbed to about $2,200, where it met resistance from short-term resistance. However, the ETH/USD pair bounced off the lows to reach a medium-term high at $2,484 as of the time of this post.
If the upward trend continues, the no.2 crypto price will initially challenge the $2,500 level of resistance. After then, different round pricing levels could be able to propel the pair. A prospective pullback, on the other hand, would almost certainly test the 4-hour moving averages 50 & 200 support as well as the lower trend line of the late-Dec channel up pattern.
Note: Kryptomoney.com is not a financial advisor. Do your research before investing your funds in any financial asset or presented product or event. We are not responsible for your investing results
Image Credit: Shutterstock


Keep in mind that we may receive commissions when you click our links and make purchases. However, this does not impact our reviews and comparisons. We try our best to keep things fair and balanced, in order to help you make the best choice for you.