
The cryptocurrency market is varied but mainly characterized by mild price movements while a bearish wave swept through on Friday leaving most crypto assets in the red. The Etheruem cryptocurrency had surged towards the $400 psychological level against the US Dollar as of October 12 before bleeding its way lower. Since then, buyers seemed to have lost steam giving way to mild selling pressure plunging the ETH/USD price under the $370. The crypto asset is currently second on the Coinmarketcap table, with a market cap of $41.50 billion and $14.93 billion in trade volume over the past 24 hours. The current ETH/USD spot price is down approx 3% in 24 hours while trading at $367. Whales have been consolidating their positions before Ethereum’s transition to ETH 2.0 as per Santiment’s holders’ distribution. Since mid-July, the number of addresses holding around 100,000-1 million ETH has risen by 13, from 153 to 166. While we consider that these investors hold between $40 million and $400 million in ETH, this indicates a major increase in buying pressure.
*The Ethereum cryptocurrency had surged towards the $400 psychological level against the US Dollar as of October 12 before bleeding its way lower
*Buyers seemed to have lost steam giving way to mild selling pressure plunging the ETH/USD price under the $370
*Whales have been consolidating their positions before Ethereum’s transition to ETH 2.0. as per Santiment’s holders’ distribution
Key Levels
Resistance Levels: $500, $450, $400
Support Levels: $355, $335, $310
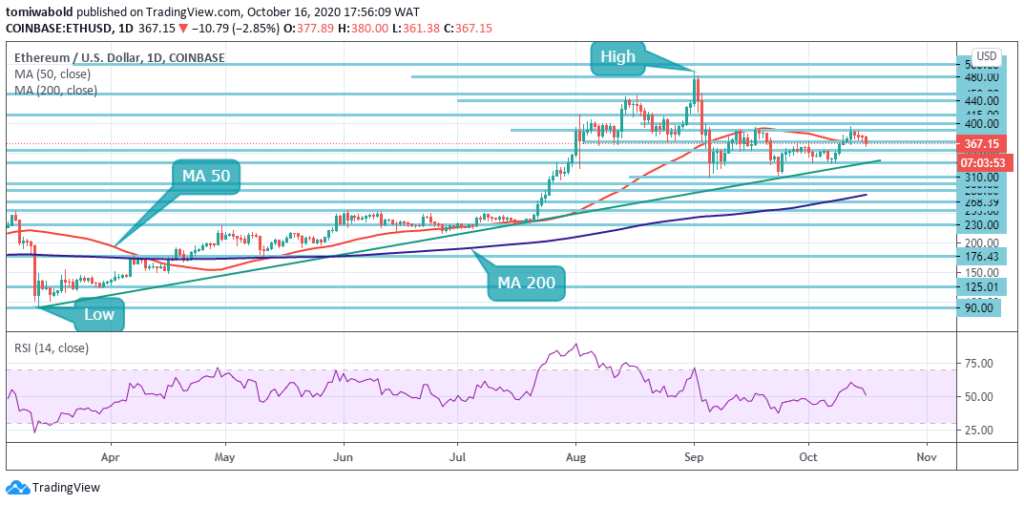 ETH/USD Daily Chart
The price met resistance and fell marginally to lows of $361 on Friday after rising rapidly from a low of $365 to $395 on Monday. MA 50 has struggled to hold the selling pressure at present. The RSI indicates that market traction is still bullish beyond its 50 midlines, so before making another charge towards the $400 resistance line, it may be probable that the coin is going through a near-term pullback.
Once the bulls can sustain momentum, they ought to be able to reach the $500 region, given they breach past the $400 resistance line detailed earlier. Although the long-term outlook looks extremely optimistic, there could still be a possibility for the bears to reclaim market share. They should be able to take the price down to the ascending trendline support at $335 if the sellers seize control and gain ample steam.
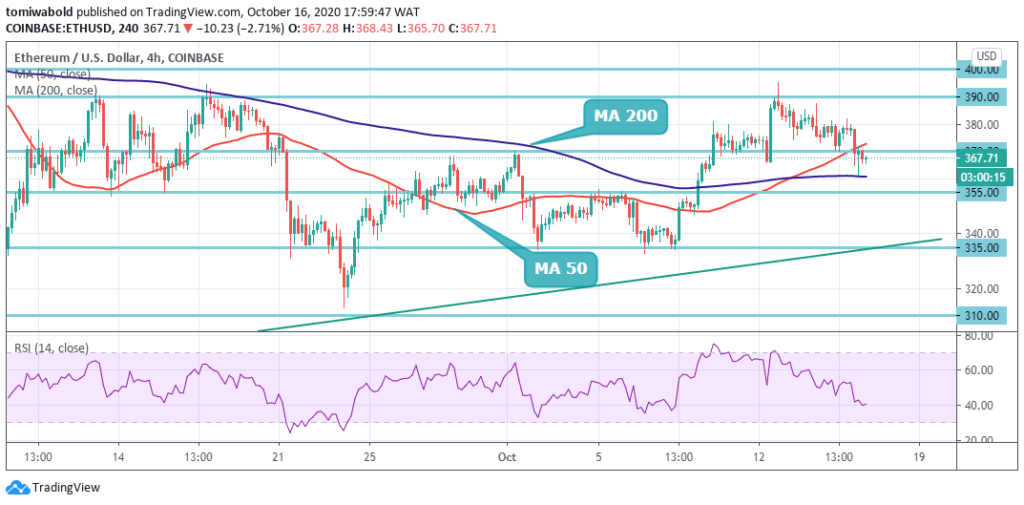 ETH/USD 4-Hour Chart
Ethereum has been under mild selling pressure on the 4-hour timeframe after breaching lower the MA 50 as top Altcoins continue to reverse lower, following the early-week cryptocurrency market rally. A bullish inverted pattern of the head and shoulders holds and forecasts a potential move towards the region of $400. To trigger the bullish reversal trend, ETH/USD bulls need to drive the price beyond the $390 mark.
Thus far, the buyers have the permission to attempt the $500-zone, as the 4 hour MA 200 offers solid support while the price is about to flip the MA 50 from resistance to support. The ETH/USD pair is only bullish while exchanging beyond the $370 level, key resistance is found at the $395 and the $400 levels. If the ETH/USD pair stays beneath $370, the $355 and $335 support levels may be tested by sellers.
Note: Kryptomoney.com is not a financial advisor. Do your research before investing your funds in any financial asset or presented product or event. We are not responsible for your investing results
Image Credit: Shutterstock


Keep in mind that we may receive commissions when you click our links and make purchases. However, this does not impact our reviews and comparisons. We try our best to keep things fair and balanced, in order to help you make the best choice for you.
