
Ethereum (ETH) is back on its journey towards $500 while confronting its 2020 all-time high of $488. The hunt for support took longer than expected, with ETH spiraling under $450. However, a bottom was recently discovered for ETH around $430-$400, breathing fresh air into the market. Following a second rejection slightly below $470, Ethereum bulls triggered their line of defense. With little opposition, the upside rally continues as ETH/USD edges up towards $480. The quest for a greater demand zone is such that the uptick to $500 can be revived by Ethereum. The crypto asset is currently second on the Coinmarketcap table, with a market cap of $53 billion and $13.60 billion in trade volume over the past 24 hours. The price is currently trading beneath prior resistance at $470. ETH/USD may reactivate the traction towards $500 as it inches closer to much-awaited Ethereum 2.0. The market is currently in a waiting stance on the launch of the genesis phase of Ethereum 2.0 to whose deposit contract address over 50,000 ETH has already been sent.
*A bottom was recently discovered for ETH around $430-$400, breathing fresh air into the market
*With little opposition, the upside rally continues as ETH/USD edges up towards $480
*ETH/USD may reactivate the traction towards $500 as it inches closer to the much-awaited Ethereum 2.0
Key Levels
Resistance Levels: $550, $500, $470
Support Levels: $450, $430, $400
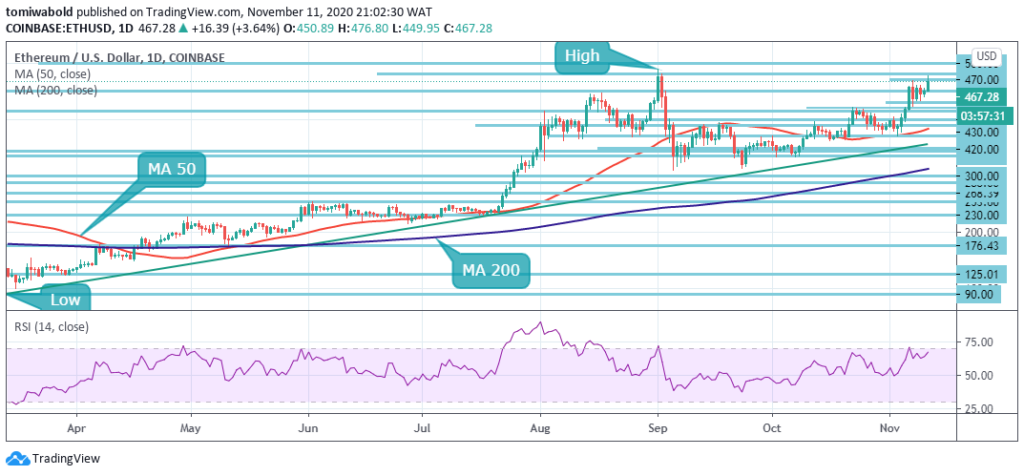 ETH/USD Daily Chart
On the daily chart, ETH/USD next significant barrier seems to be established on the chart around its 2020 all-time high of $488. A breakout above this point could easily drive Ethereum beyond $500 towards $800. Following an earlier price rejection at the $470 medium-term barrier, the digital asset has seen a notable breakout towards $480, negating a possible retracement.
Ethereum price is above its daily MA 50 and MA 200 with a price target of $500 beyond the high of 2020. The RSI has also sustained its bullish stance which was followed by a 20% price explosion. A similar move would create a price target at $550, especially if the Ethereum price can break $488. However, rejection from the high at $488 may create a potential double top and may drive the price towards $450 to re-test the lower boundary of the horizontal channel.
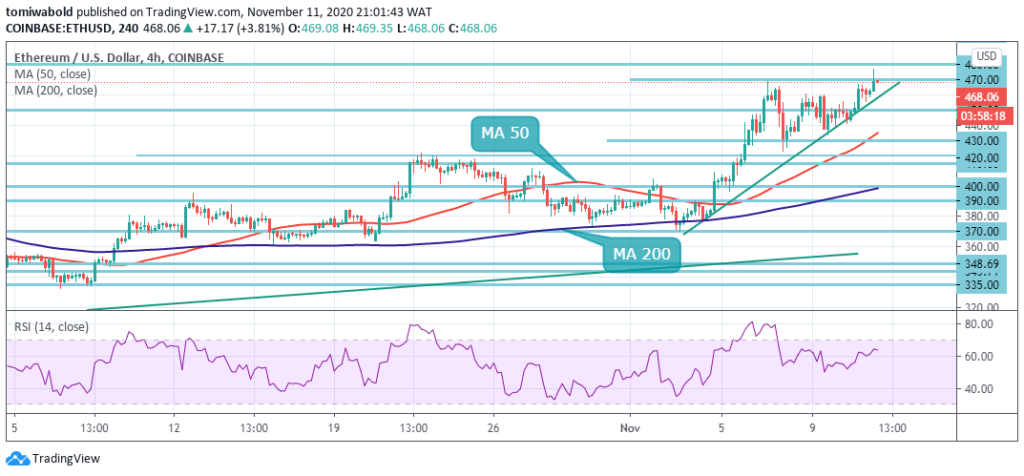 ETH/USD 4-Hour Chart
ETH/USD has staged a bullish breakout above a triangle pattern on the 4-hour time frame, sending the price towards the $480 resistance level. The ETH/USD pair could soar towards the $500 area if the breakout above the $450 level stays intact. Investors should note that the $470 offers the strongest takeoff or rejection point of the upcoming technical zone for the ETH/USD pair.
If the losses progress beneath $450 and Ethereum slides under the ascending trendline, a selloff could further trigger ETH decline. The ETH/USD pair is only bullish while trading above the $430, key resistance is found at the $470, $480, and the $500 levels. If the ETH/USD pair trades below the $430 level, sellers may test the $400 and $390 support levels.
Note: Kryptomoney.com is not a financial advisor. Do your research before investing your funds in any financial asset or presented product or event. We are not responsible for your investing results
Image Credit: Shutterstock


Keep in mind that we may receive commissions when you click our links and make purchases. However, this does not impact our reviews and comparisons. We try our best to keep things fair and balanced, in order to help you make the best choice for you.