
Ethereum’s rise has been nothing short of astonishing, despite its status as Bitcoin’s major competitor. The ETH/USD pair has been weak since the beginning of the week, with little major reason to move in any direction. Active players in the crypto market paused to assess the situation as adoption continues to climb. Nevertheless, no signals of bear capitulation, i.e. short-squeeze, or, conversely, an easing of the bulls’ hold with fresh highs, have been seen in recent days. Instead, profit-taking on intraday highs and buying at lows is driving the ETH trend into a range. After failing to climb over the moving average (MA 50) around the $2,900 level earlier in the week, the ETH/USD pair is bearishly exposed to the nearby $2,200 level. At the time of this post, ETH trades at $2,426 as the upside rally fades amid a bullish bounce from a $2,259 intraday low. According to the most recent data from crypto analytics company Glassnode, the quantity of Ethereum (ETH) traded on major crypto exchanges has dropped to its lowest point in over 2 years. From over 19 million Ethereum in July 2020 to fewer than 13 million now, crypto trading platforms have seen a 31% drop in their holdings.
Key Levels
Resistance Levels: $3,500, $3,000, $2,550
Support Levels: $2,200, $1,728, $1,292
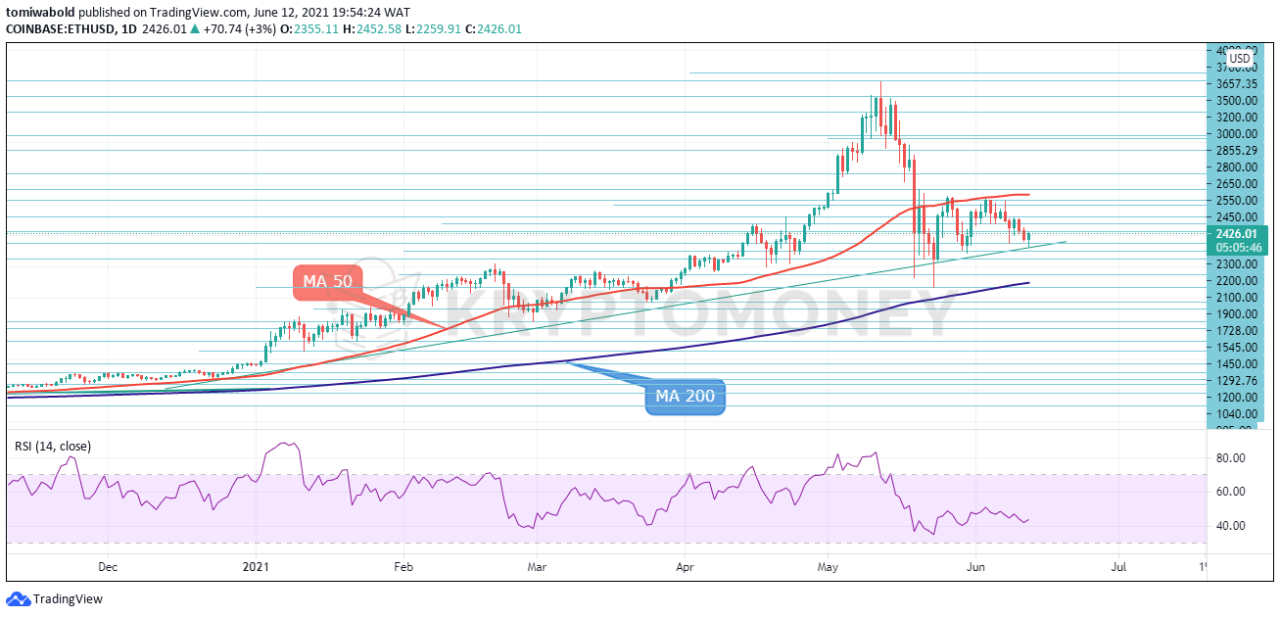 ETH/USD Daily Chart
Ethereum (ETH) bounced from support while searching for direction against the US dollar, it consolidates near the technically important $2,500 level. If sellers claim the $2,200 mark, all eyes will turn to the May 23rd low of $1,728 level. Beneath that, the pair will confront the moving average (MA 200) and reactivate a fresh rebound, with the price likely searching for a new lower low around $1,500.
If the bulls can overcome the sell-off and push the price over the $2,500 barrier and, the moving average (MA 50) at $2,900 the upside rally may come back into focus. Buyers, on the other hand, want to see a rally above the ascending trendline that runs from the Dec 2020 low of $551 to the higher low of $2,200 continues to move higher. In summary, the ETH/USD might drop to a May 23rd low of $1,728 unless nearby support of $2,200 acts as a roadblock.
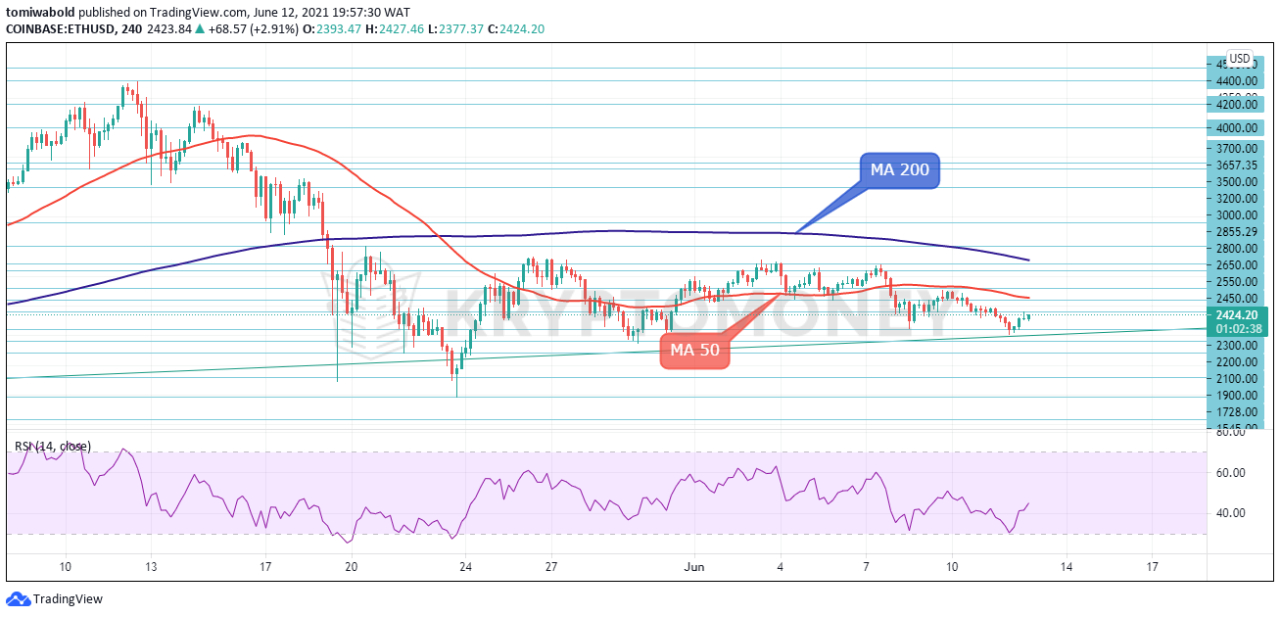 ETH/USD 4-Hour Chart
On the 4-hour chart, to promote technical buying towards the moving average (MA 50), short-term bulls must lift the price over the $2,550 resistance level. To intensify selling pressure on the ETH/USD, bears must keep the price below $2,550. Before establishing short-term buying positions, patient traders may wish to wait for a jump in ETH volatility.
To summarize, the ETH/USD is looking to sustain the bounce from $2,259, but only a big rally over $2,550 would give the bulls the upper hand. The relative strength index (RSI) is maintaining an upward trend in the medium term, which will be tested if the price hits the stable resisting MA 50 barrier.
Note: Kryptomoney.com is not a financial advisor. Do your research before investing your funds in any financial asset or presented product or event. We are not responsible for your investing results
Image Credit: Shutterstock


Keep in mind that we may receive commissions when you click our links and make purchases. However, this does not impact our reviews and comparisons. We try our best to keep things fair and balanced, in order to help you make the best choice for you.