
The majority of crypto assets, especially in the top 100 are in the red after BTC plunged again from highs above $52k. Ethereum faced a heavy sell-off after reaching yearly highs of $2,041 on Feb.19. Ethereum started a rebound when it hit support at $1,292 on Feb. 28. However, ETH could not sustain the advance beyond $1,657, leading to losses below $1,500. An upside run resumes from around this zone as bulls on ETH/USD fixate on $2k. Ethereum bulls may be rolling their sleeves for a fresh record high but there is a need to validate their strength as the bears are still in the market. At the time of writing, Ethereum is exchanging hands at $1,599, marginally up by 1.79% on the day and 2.42% down on a 7-day basis. Ranking 2nd largest by market cap, Ethereum’s market valuation now stands at $182.58 billion with a trading volume of $22.46 billion in the past 24 hours. On-chain metrics bolster Ethereum’s bullish sentiment amongst investors even after the recent price dip. Despite Ethereum’s recent correction, the futures and options metrics held bullish levels during the downturn. The futures premium held very healthy levels while the options skew remained neutral-to-bullish.
*ETH could not sustain the advance beyond $1,657, leading to losses below $1,500
*Ethereum is exchanging hands at $1,599, marginally up by 1.79% on the day and 2.42% down on a 7-day basis
*On-chain metrics bolster Ethereum’s bullish sentiment amongst investors even after the recent price dip
Key Levels
Resistance Levels: $2,041, $1,800, $1,660
Support Levels: $1,493, $1,350, $1,200
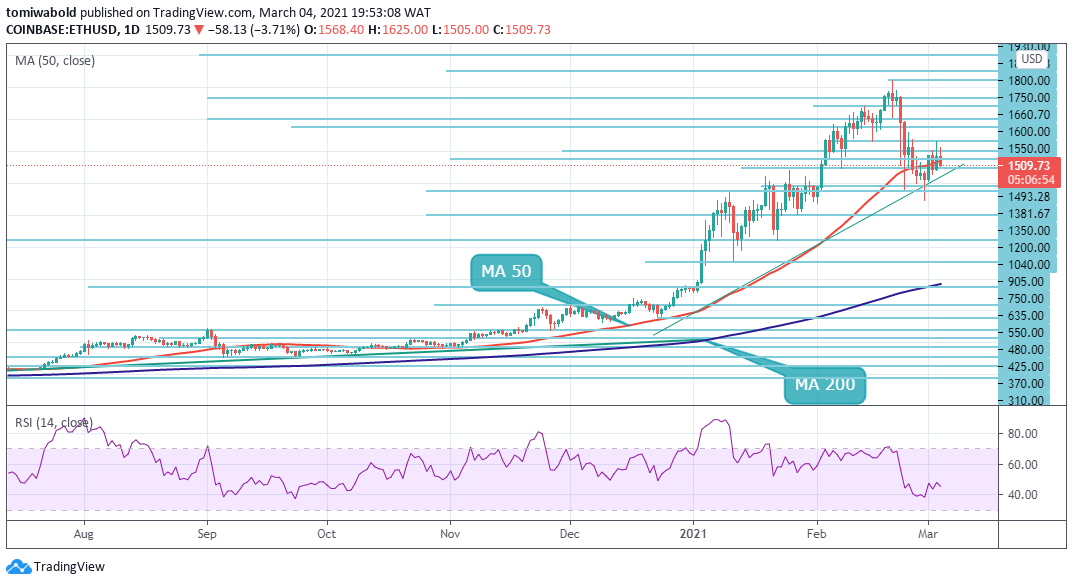 ETH/USD Daily Chart
Ethereum bounced off the MA 50 support at $1,540 on March 4, but could only sustain the move to intraday highs of $1,625. ETH upside momentum stalled short of $1700 for the second time again, the first being on March 3. If the bulls can propel the price above $1,714, the pair may rally to $2,000. The daily RSI will still need to rise further and break above the midline to indicate the bulls are in charge again.
The bears are unlikely to give up easily as they may try to stall the up-move at the current levels. Given that, if the price turns down from the MA 50 support, the ETH/USD pair could risk declining back to $1,455 coinciding with the ascending trend line support. A sustained break beneath the ascending trendline support may signal a trend change. In this case, the ETH/USD pair could correct to $1,292 and then $1,120 level.
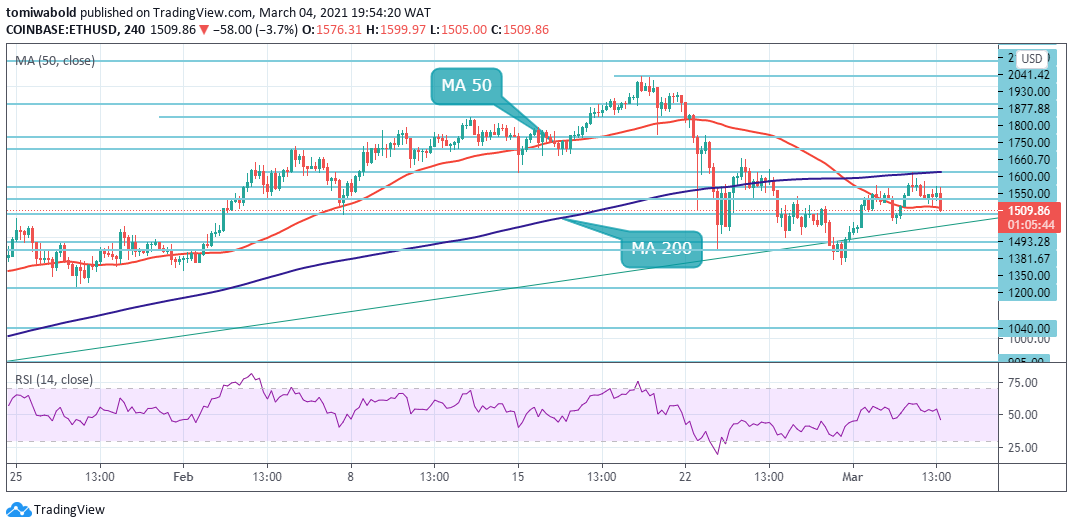 ETH/USD 4-Hour Chart
On the 4-hour chart, the buyers managed to push ETH price to the MA 200 resistance cap at $1,653 today but the bears are not ready to give up just yet. Ethereum is presently depending on the MA 50 support at $1,518 to hold. A sustained break below the MA 50 may send ETH price spiraling down to $1,466 and $1,292.
On the contrary, this negative view will invalidate if the bulls can push and sustain the price above the MA 200 cap at $1,653. In this case, the ETH/USD pair could gain momentum to $1,710 and ultimately $2,041. The ETH/USD pair is only bullish while trading above MA 50, key resistance is found at the $1,660 and $2,041 levels.
Note: Kryptomoney.com is not a financial advisor. Do your research before investing your funds in any financial asset or presented product or event. We are not responsible for your investing results
Image Credit: Shutterstock


Keep in mind that we may receive commissions when you click our links and make purchases. However, this does not impact our reviews and comparisons. We try our best to keep things fair and balanced, in order to help you make the best choice for you.