
The crypto market raises doubt on price development in the short term, however, investors are still optimistic about Ethereum’s medium to long-term prospects despite current price weakness. This weekend saw one attempt by ETH to reach the $400 price level. Following its failed attempt against the US dollar, the upside track turns south on ETH/USD beneath $355. ETH/USD has declined from a high of $376.76 to register an intraday low of $331 level. The crypto asset is currently second on the Coinmarketcap table, with a market cap of $38.19 billion and $19.38 billion in trade volume over the past 24 hours. The ETH/USD pair is currently trading at $338 and continues lower for the second day in a row. The current ETH/USD spot price is down 35% from its yearly high set on Sept 1. Ethereum Balance on Exchanges drops to bolster DeFi Rave according to Glassnode. The volume of ETH owned by users on crypto exchanges has declined dramatically and struck a 9-month low. As ETH exchange balances are in sharp fall, therefore, this is reflective of the fact that users are moving their ETH to DeFi and locking them into smart contracts for yield farming.
*ETH/USD has declined from a high of $376.76 to register an intraday low of $335 level
*Following its failed attempt against the US dollar, the upside track turns south on ETH/USD beneath $350
*Ethereum Balance on Exchanges drop to bolster DeFi Rave according to Glassnode
Key Levels
Resistance Levels: $415, $390, $355
Support Levels: $335, $310, $288
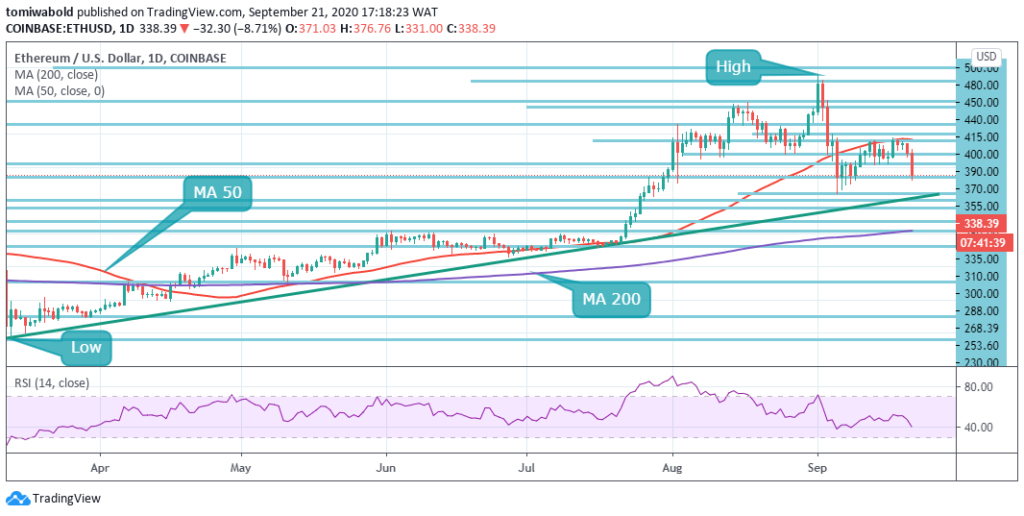 ETH/USD Daily Chart
ETH/USD fluctuated in a relatively tight range in the prior week and came in under strong selling pressure on Monday. Ethereum staged a decisive rally but failed to climb above the critical $400 level. Since the failed attempt, sellers have been gaining traction suggesting that the downward correction could extend to $310 (retracement to early-September drop).
On the downside, the initial support aligns at the ascending trendline at $300. If Ethereum retreats to this area and confirms it as a support, it’s likely to retest $400 in the medium-term. Below $300 the next support could be seen at $288. Meanwhile, the RSI indicator on the daily chart dropped towards 40, suggesting that there is more room on the downside before the next led up.
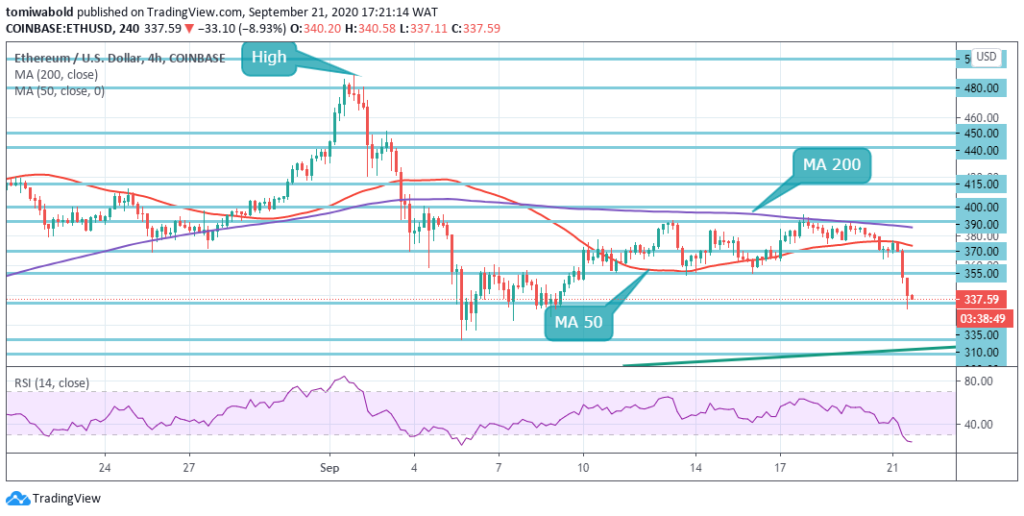 ETH/USD 4-Hour Chart
Ethereum is once back under heavy selling pressure, due to an increase in risk-off trading sentiment and strength in the US dollar currency. A bearish pattern has formed on the lower time frames after price traded under the MA 50 and is warning of a coming decline towards the $300 area. A sustained break under the $335 level is required to activate the bearish reversal pattern.
Technical analysis shows that a break under the $335 support level could see the ETH/USD pair slipping towards the $310 level. The ETH/USD pair is only bullish while trading above the $390 level, key resistance is found at the $400 and the $415 levels. If the ETH/USD pair trades below the $335 level, sellers may test the $310 and $300 levels.
Note: Kryptomoney.com is not a financial advisor. Do your research before investing your funds in any financial asset or presented product or event. We are not responsible for your investing results
Image Credit: Shutterstock


Keep in mind that we may receive commissions when you click our links and make purchases. However, this does not impact our reviews and comparisons. We try our best to keep things fair and balanced, in order to help you make the best choice for you.