
Fantom (FTM) is up nearly 4% in the last 24 hours against a backdrop of bitcoin and the majority of altcoins that traded in the red. At the time of publication, FTM was changing hands at $0.362, up 5.54% over the last seven days. The Hector network, a Fantom-based blockchain, has locked down a huge partnership with one of the largest football clubs in the world, Borussia Dortmund. It announced in a tweet, “We’re champion partners of Borussia Dortmund!” “BVB is one of the most iconic football clubs in the world.” Borussia Dortmund, BVB, or simply Dortmund, is a German professional sports club based in Dortmund, North Rhine-Westphalia, dating back to 1909. This sponsorship hopes to bring the Hector network game-changing publicity, engagement, and mainstream visibility.
Key Levels
Resistance Levels: $0.6049, $0.4300, $0.3717
Support Levels: $0.3200, $0.2882, $0.2213
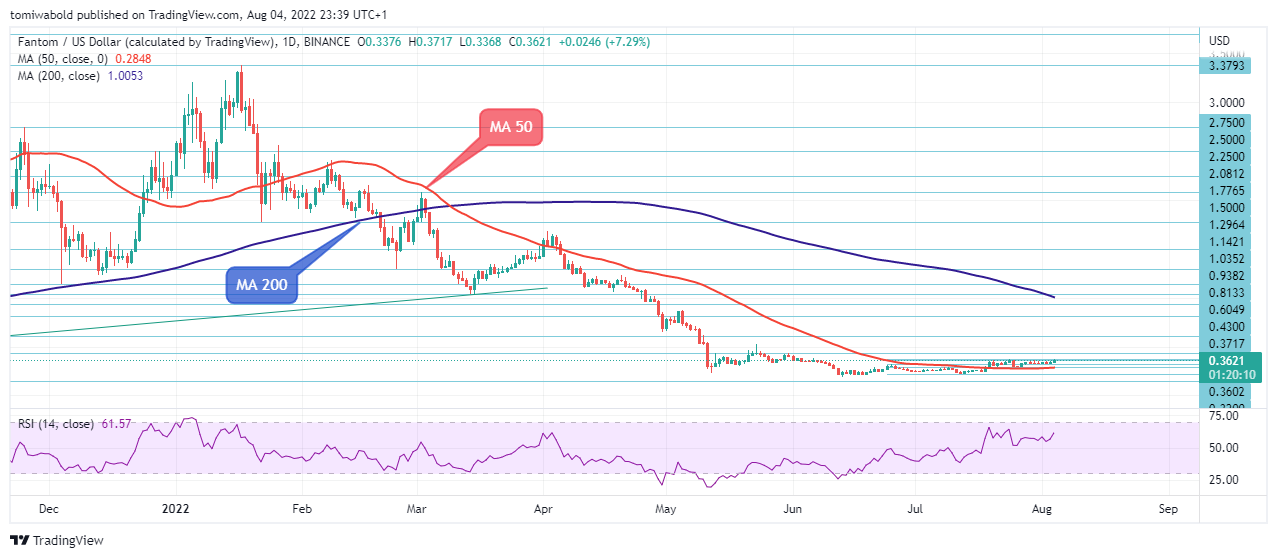 FTM/USD Daily Chart
The daily moving average (MA 50) limits the initial downside after FTM/USD crossed higher on July 19. However, if Fantom (FTM) fails to break through the next horizontal resistance around $0.4300, traders should expect a selloff in the $0.3000 zone. Furthermore, breaking through the resistance may place FTM in a convergence zone for traders between the MA 50 at $0.3000 and MA 200 at $1.0000.
Breaking the mentioned zone higher is expected to result in a bullish run. However, even in the most unlikely situation of a trend reversal, the cryptocurrency’s support levels remain solid above $0.3000. Fantom (FTM) continues its recovery above the daily moving average (MA 50) and the support level of $0.3000 as it conserves energy ahead of the next major break.
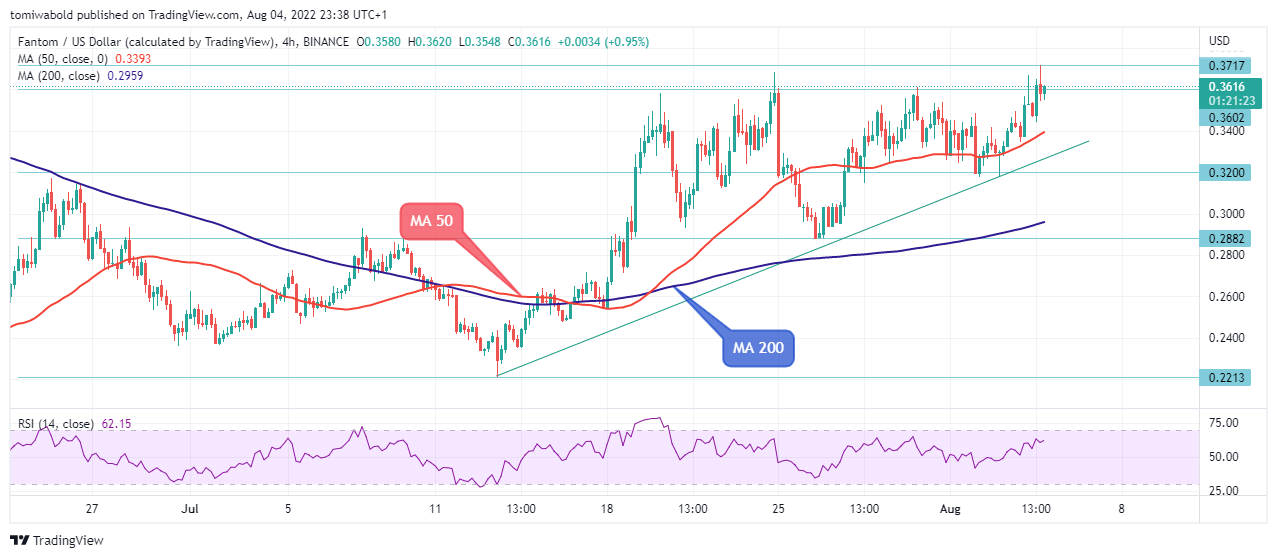 FTM/USD 4-Hour Chart
The price of FTM/USD has gradually risen from its July low of $0.2213 low past the 4-hour moving average (MA 50) at $0.3400. Price has once again bounced off the MA 50 to reach an intra-day high of $0.3717, where it is currently consolidating. On the negative side, MA 50 at $0.3400 serves as temporary support ahead of the $0.3200 and $0.2882 significant support levels.
However, layers of support and an ascending trendline show an upward tilt and may provide some comfort. When momentum traders join the party, a bullish breakout beyond here would set off a protracted surge above $0.3717. A drop below $0.3400 (MA 50) would, on the other hand, extend the sideways movement to $0.2929 at the MA 200. A break below the moving averages could result in a repeat of the $0.2213 lows.
Note: Kryptomoney.com is not a financial advisor. Do your research before investing your funds in any financial asset or presented product or event. We are not responsible for your investing results
Image Credit: Shutterstock


Keep in mind that we may receive commissions when you click our links and make purchases. However, this does not impact our reviews and comparisons. We try our best to keep things fair and balanced, in order to help you make the best choice for you.