The cryptocurrency market sentiment appears to be shifting to the positive following a volatile May. Hedera Hashgraph (HBAR) is climbing for the third consecutive day after hitting support at around $0.17 on June 12. At the time of writing, HBAR was exchanging hands at $0.213, up 8.57% in the last 24 hours and 1.01% weekly. Hedera Hashgraph has a present market capitalization of $1.79 billion and $137 million in trade volume over the past 24hrs. SportsIcon, one of the world’s leading platforms for sports, partners with the greatest athletes of all time to turn their stories and moments into NFTs on Hedera Hashgraph. Gianluigi Buffon, Roberto Carlos, Fenerbahçe, Corinthians and others, have reportedly announced NFTs on SportsIcon. Chris Worsey, SportsIcon co-founder stated ”After an evaluation of various public networks and blockchains, we found that Hedera’s performance, cost, and ecological friendliness felt unmatched.”
Key Levels
Resistance Levels: $0.3500, $0.3000, $0.2500
Support Levels: $0.2000, $0.1500, $0.1000
 HBAR/USD Daily Chart
Hedera Hashgraph has been trading within a sideways range since mid-March. This marks a consolidation phase within the bigger uptrend that took the asset to all-time highs of $0.459 on March 15. The RSI gliding towards the 50 thresholds is suggesting extended consolidation. After a deflection off the highs of $0.374 on May 18, HBAR/USD now rests on the MA 200 ($0.182) which offers strong downside support and from where it resuscitated a positive climb on June 12.
Above current levels, the first target for the bulls would be $0.247, before the focus turns towards the upper bound of the recent range at $0.262 coinciding with the MA 50. A break of this level would signal the continuation of the larger uptrend, opening the door for a test of the $0.37-$0.38 region ahead of the all-time highs of $0.459.
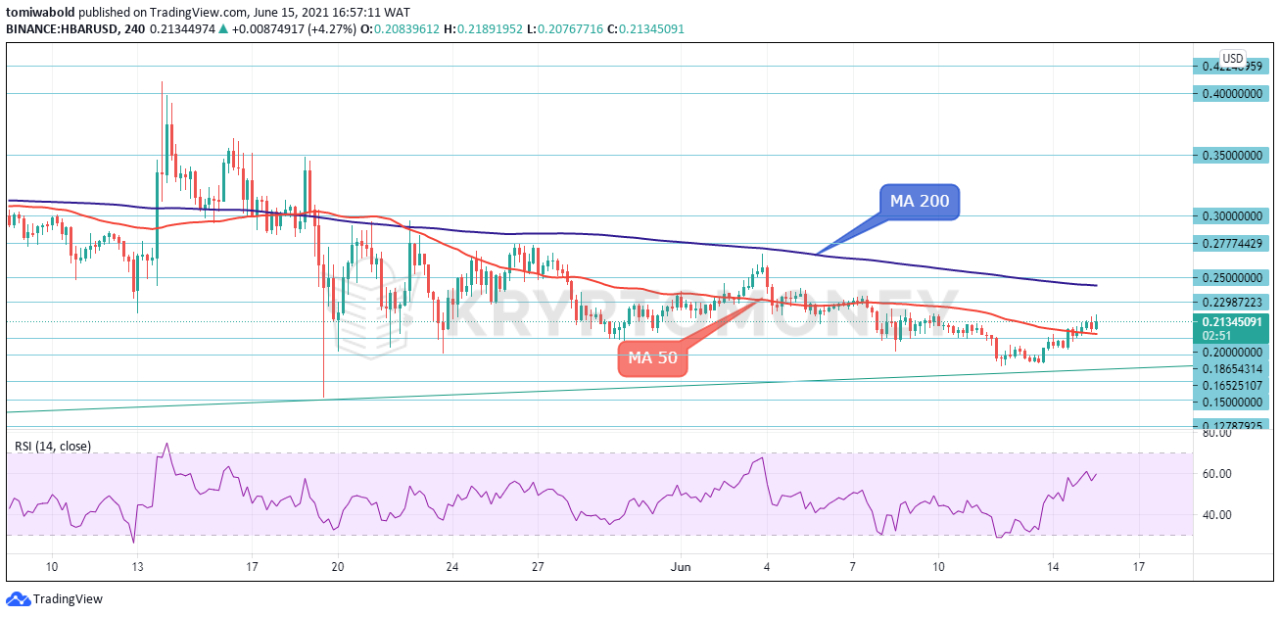 HBAR/USD 4-Hour Chart
On the 4-hour chart, Hedera remains in a large price range capped above the moving averages. However, HBAR gained ground above the MA 50 ($0.2037) in today’s trading to reach highs of $0.2214. Gains above the $0.2214 price area could cause the HBAR/USD pair to rally towards the MA 200 ($0.243). Overcoming this boundary could propel the price towards the resistance belt of $0.36-$0.40.
Conquering this too could raise optimism with buyers likely to challenge the all-time highs of $0.459. Alternatively, If sellers take control, the first area to offer support may be around $0.203 which coincides with the MA 50. Stepping lower, the $0.187 level could halt any declines before a tougher barrier appears at the lower end of the range at $0.151. Summarizing, HBAR/USD neutral-to-bullish tone stays. A break on either side of the range will reveal the next directional wave for the pair.
Note: Kryptomoney.com is not a financial advisor. Do your research before investing your funds in any financial asset or presented product or event. We are not responsible for your investing results
Image Credit: Twitter


Keep in mind that we may receive commissions when you click our links and make purchases. However, this does not impact our reviews and comparisons. We try our best to keep things fair and balanced, in order to help you make the best choice for you.