Hedera (HBAR) is trading at $0.058, down 3.38% in the last 24 hours. According to data shared by onchain analytics firm, Messari, Hedera rebounded in Q3 following a chaotic second quarter across the crypto space. The network saw impressive increases in activity, reaching all-time highs in its DeFi and NFT segments. Driven by the launch of its first DEX, SaucerSwap, Hedera ended Q3 with $100 million in TVL. Stader Labs, a liquid staking platform, is responsible for most of the network’s TVL, accounting for $80 million of the $100 million total network’s TVL. Hedera’s NFT segment saw impressive growth during Q3 with active users and transactions both increasing over 90% quarter on quarter. Much like the DeFi sector, Hedera’s activity is driven by two applications in Hash Axis and Zuse Market. Taking steps to decentralize, Q3 saw governance enabled by the staking of HBAR. Overall, Q3 was a strong quarter for Hedera as it continues to build and expand during the bear market.
Key Levels
Resistance Levels: $0.0850, $0.0743, $$0.0674
Support Levels: $0.0553, $0.0456, $0.0300
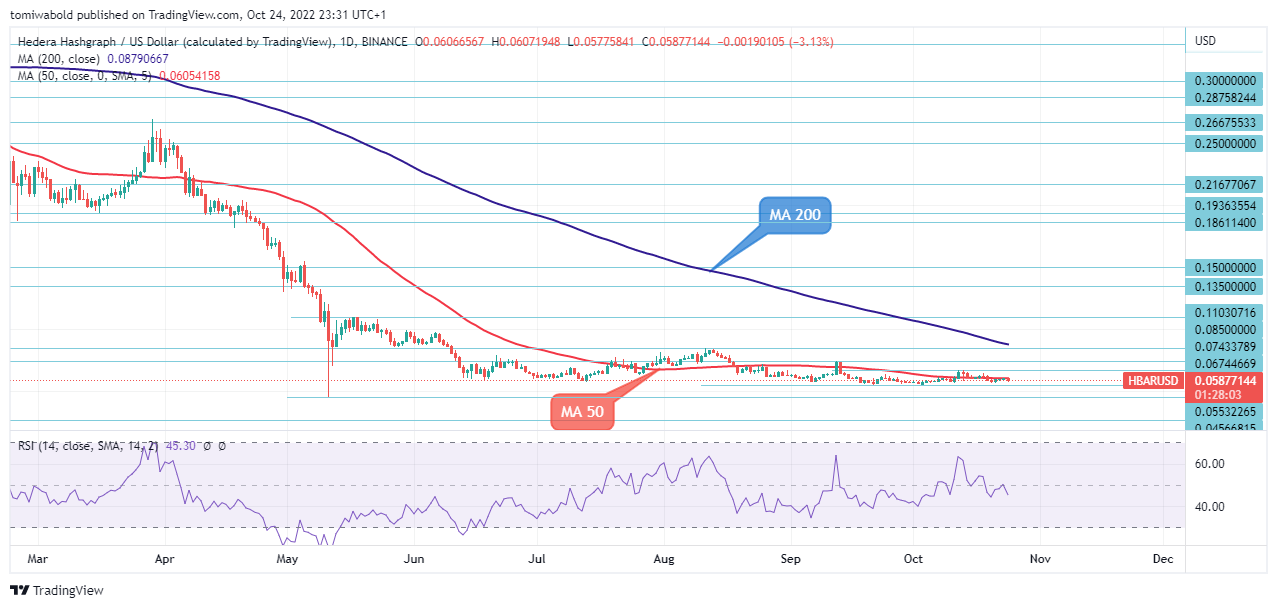
 HBAR/USD Daily Chart
The HBAR/USD consolidated gains throughout Monday’s trading hours. Following its attempt to cross the daily moving average (MA 50), the pair is retreating from its daily highs at $0.0607. The HBAR/USD pair is currently trading below $0.0600 as buyers seek confirmation beyond the daily chart’s critical zone.
Earlier, the HBAR/USD found support on the daily chart at $0.0564 in the prior week, and a break below that level could lead to a test of lower levels. The pair has been consolidating in a narrow trading range between $0.0553 and $0.0674 for the previous week. In contrast, a sustained break of the $0.0674 resistance zone would indicate a return to higher ground.
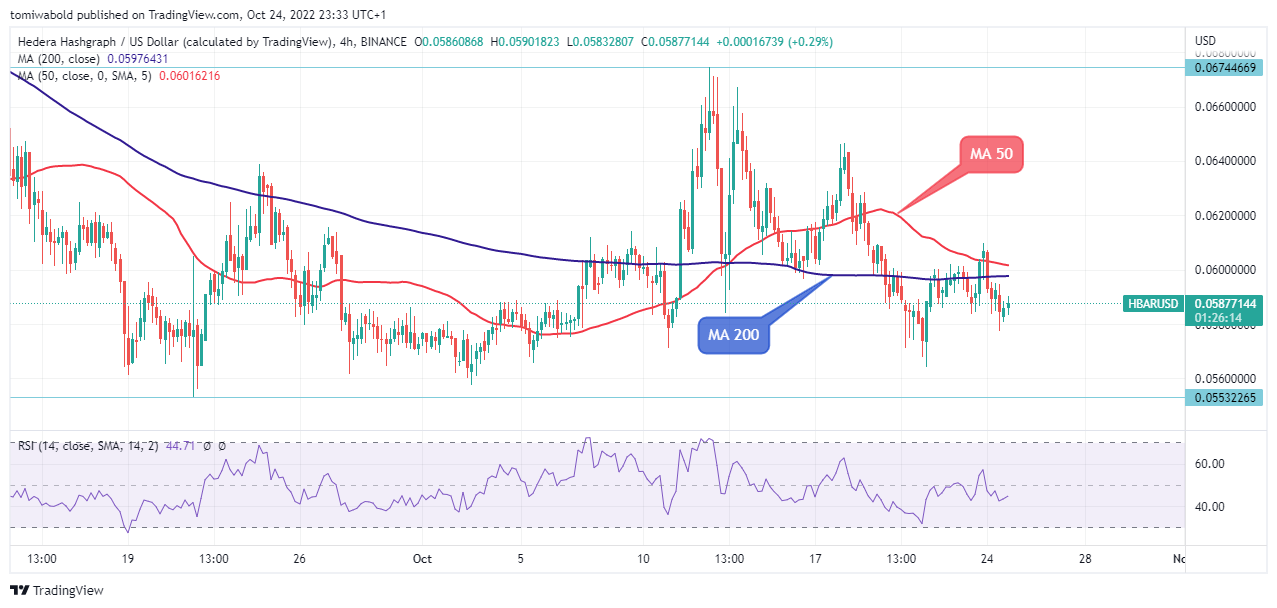
 HBAR/USD 4-Hour Chart
The HBAR/USD is expected to rebound further despite resistance at $0.0600 around the 4-hour moving average (MA 50 & MA 200). The most recent gain from $0.0564 is regarded as another comeback phase of the pattern. The intraday trend is range-bound, with key resistance at $0.0674. Otherwise, a greater rebound might keep the trend optimistic.
The breach may extend the recovery to $0.0743, while a break of the minor support level of $0.0577, on the other hand, would result in a negative inclination toward the support level of $0.0553. At the moment, the HBAR/USD pair appears to be susceptible to further drops and a desire to remain below its shorter MAs.
Note: Kryptomoney.com is not a financial advisor. Do research before investing your funds in any financial asset, presented product, or event. We are not responsible for your investing results
Image Credit: Shutterstock
Keep in mind that we may receive commissions when you click our links and make purchases. However, this does not impact our reviews and comparisons. We try our best to keep things fair and balanced, in order to help you make the best choice for you.