On Tuesday, the majority of crypto assets fell amid taper talks from Fed’s James Bullard. Hedera Hashgraph (HBAR) and few selected tokens however increased in value, ignoring the market dip. At the time of writing, HBAR was trading at $0.177, up 6.64% in the last 24 hours. Hedera Hashgraph has a present market capitalization of $1.61 billion and $227 million in trade volume over the past 24hrs. Now officially launched, YamgoApp, a rewards platform powered by Hedera Hashgraph will now allow users to earn free HBAR tokens for ads, playing games, shopping, and other digital online activity. Yamgo also offers functions to store contacts, transfer HBAR, and also make HBAR purchases.
Key Levels
Resistance Levels: $0.3000, $0.2500, $0.2000
Support Levels: $0.1500, $0.1000, $0.0887
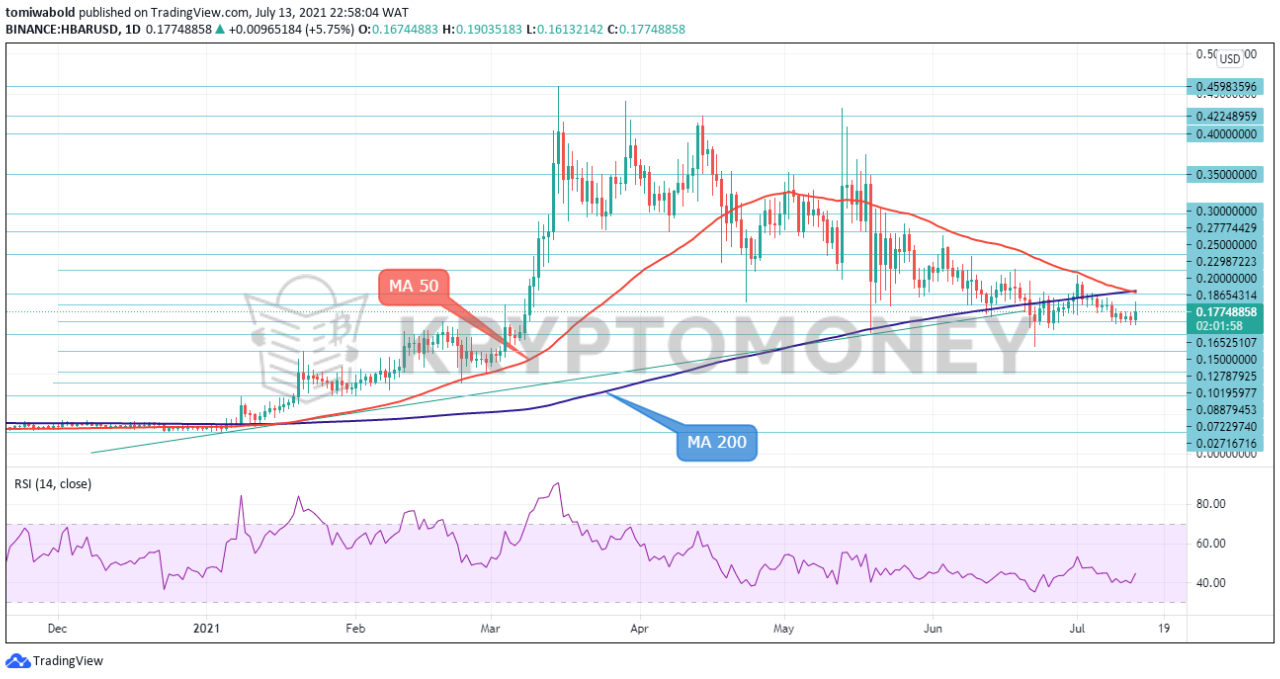 HBAR/USD Daily Chart
Hedera Hashgraph (HBAR) appears to have found some buying at the consolidative floor of $0.16, reaching highs of $0.19 in Tuesday’s trade. The RSI is indicating a pickup in sentiment, improving towards the 50 neutral marks. The convergence of the moving averages is something to keep a close eye on too in the coming sessions. Should the MA 50 cross above the MA 200, this could be a positive sign for the HBAR/USD pair.
That said, If the price forms traction off the convergent barrier of the MAs at around $0.20, early upside limitations could arise from the $0.24 level ahead of the roof of the consolidation at $0.31. Overcoming this boundary could propel HBAR price towards the resistance belt of $0.40-$0.45. Otherwise, additional support from the $0.15 level and the $0.135 low could test sellers’ efforts to steer HBAR price back down
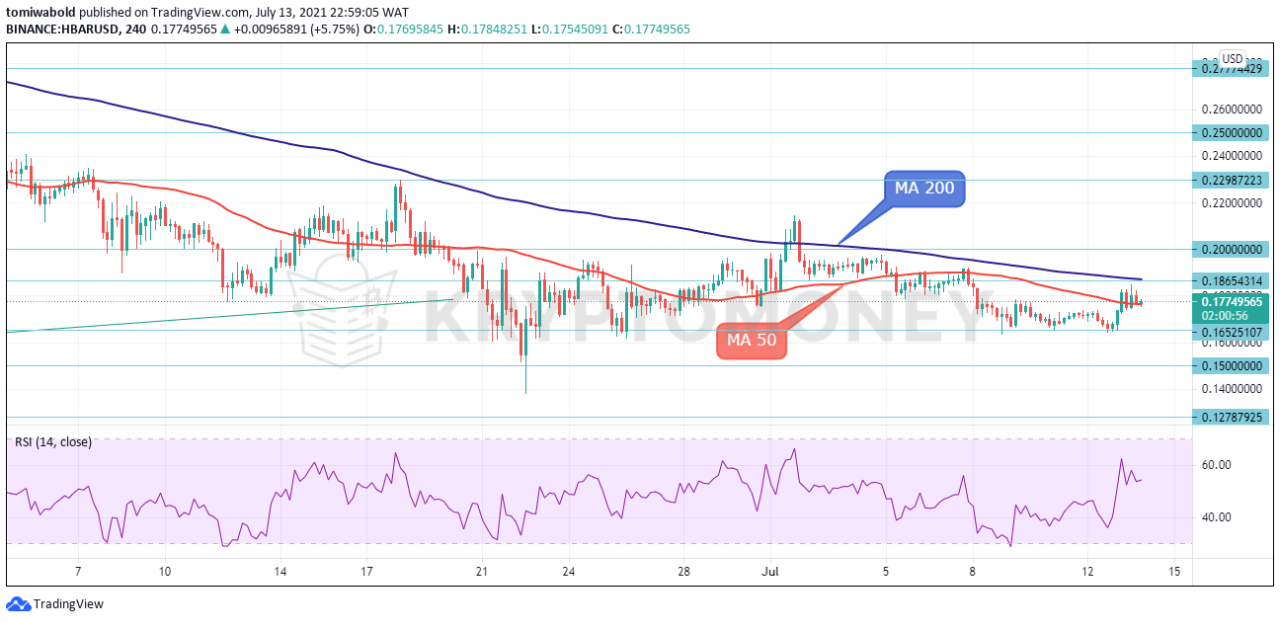 HBAR/USD 4-Hour Chart
HBAR came close to breaking the MA 200 at the $0.187 level today, reaching highs of $0.184. According to the RSI, the market could maintain positive momentum as the indicator remains above its neutral threshold of 50. On the upside, the price could attempt to hit the $0.187 resistance level at the MA 200, which if successfully broken the door could open for the $0.21 level. Should traders continue to buy the asset above this level, resistance could then run towards the $0.33-$0.40 area ahead of the March all-time highs of $0.45.
However, a reversal to the downside could find immediate support at the $0.176 level around the MA 50. If this fails to halt bearish movements, the next target could be the $0.15-$0.16 zone, identified by the recent lows.
Overall, HBAR’s consolidation pattern will persist, should bullish price action remain incapable of sustaining a decisive climb past the moving averages.
Note: Kryptomoney.com is not a financial advisor. Do your research before investing your funds in any financial asset or presented product or event. We are not responsible for your investing results
Image Credit: Shutterstock


Keep in mind that we may receive commissions when you click our links and make purchases. However, this does not impact our reviews and comparisons. We try our best to keep things fair and balanced, in order to help you make the best choice for you.