Hedera (HBAR) remains in a range amid the market’s indecisive action. At the time of publication, HBAR was changing hands at $0.06, marginally up in the last 24 hours. Korea-based LG is launching a non-fungible token (NFT) marketplace, LG Art Lab that connects to the Hedera Network, which LG supports. Owners of televisions with the most recent LG software installed will be able to buy, sell, and display their Hedera NFTs directly from their screens. Following Samsung’s introduction of an NFT marketplace on three of its TVs, all enabled by Nifty Gateway, LG has made steps into the NFT sector. Only LG TVs will support LG Art Lab. Utilizing LG’s Wallypto mobile cryptocurrency wallet, customers can buy assets by scanning a QR code to link their wallets. BNB Chain is now integrated on the hashport. Users can now port their digital assets to and from Hedera, Polygon, Ethereum, Avalanche, and BNB Chain. The HashPack App wallet is now launched on Android, and users can now manage HTS tokens and Hedera assets easily.
Key Levels
Resistance Levels: $0.0850, $0.0725, $0.0650
Support Levels: $0.0600, $0.0456, $0.0250
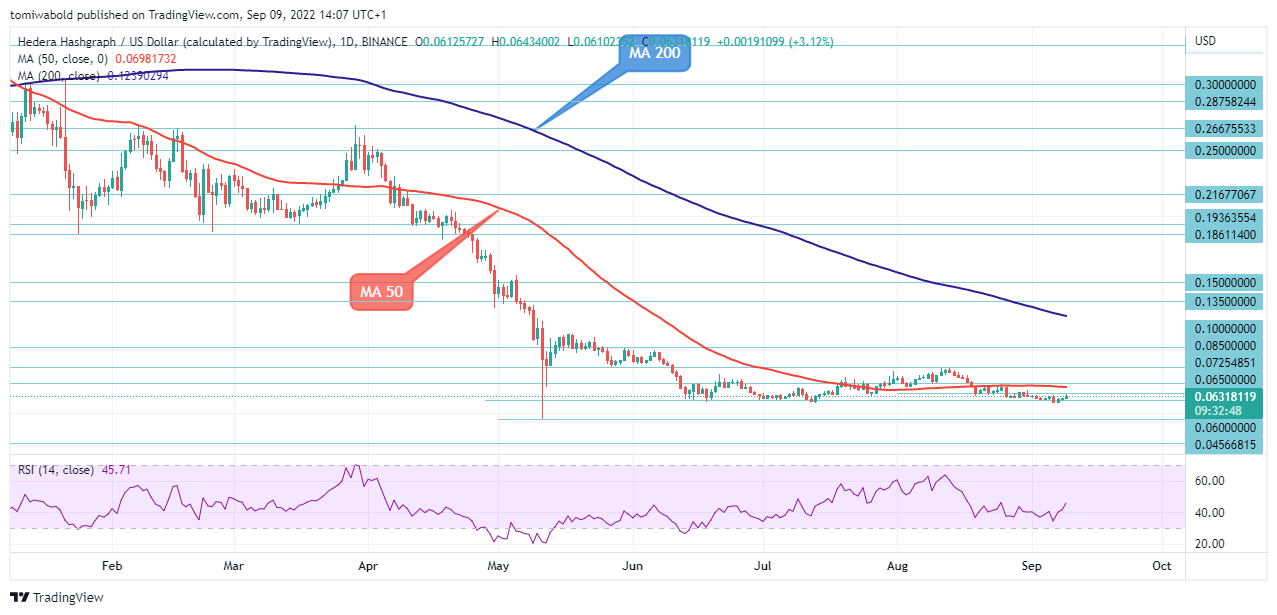 HBAR/USD Daily Chart
The HBAR/USD pair is green for the third day in a row and is currently hovering around the $0.0629 level, close to the top of its weekly trading range. Following the halt of the USD bulls, the pair encountered some steady demand on Friday and continued its upward movement from the previous day’s high level of $0.0617, towards the very important daily moving average of 5.
A close above the horizontal near-term resistance level of $0.0650 may signal the range’s breakup and open the door for a recovery of at least 100 points movement to $0.0750. The upward trend from the yearly low of $0.0456 level on May 11 may stop if prices return through the lower end of the range at $0.0600, which would realign risk towards a decline to $0.0456
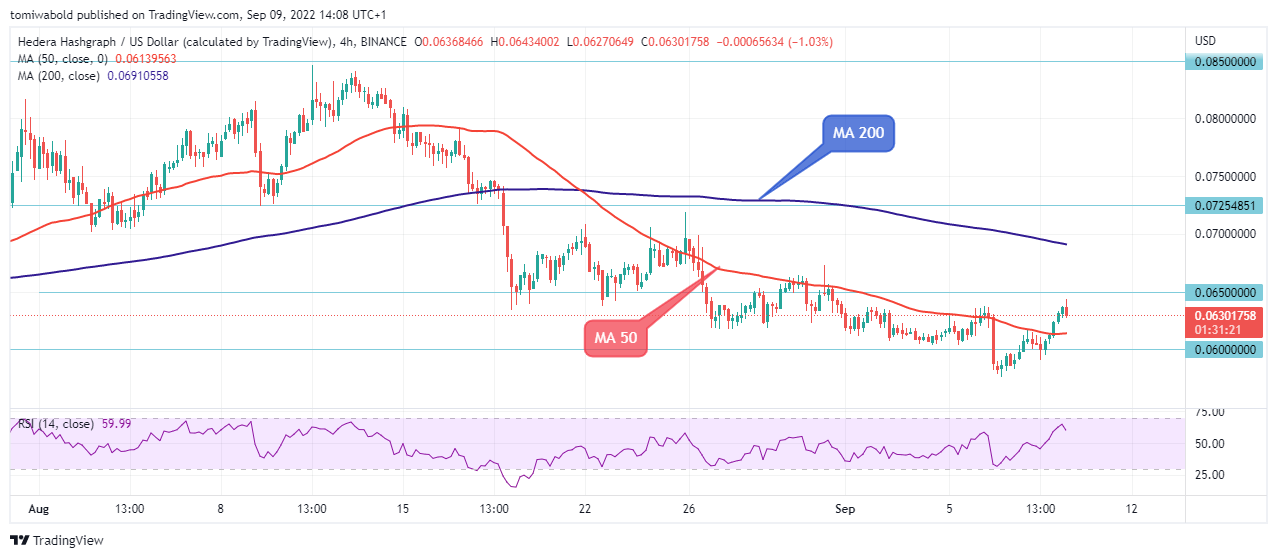 HBAR/USD 4-Hour Chart
The HBAR/USD appears to attempt to break out of its 4-hour top range at the $0.0645 level after trading above the short-term moving average (MA 50) from the $0.0575 low level. The pair could spike to a level of $0.0719 (high August 22), and a short-term moving average (MA 200). A breach of the $0.0615 on the negative will resume the slide from the $0.0700 region, leading to a retest of the $0.0575 low.
On the upside, an initial resistance is located at levels $0.0650 and $0.0719 (Aug. 22 high), with levels $0.0725 serving as the minor resistance point in late August. On the downside, a breach of the $0.0600 minor support level could see the bears continue. However, before making a significant advance, HBAR’s future gains will be restricted by local roadblocks around $0.0700.
Note: Kryptomoney.com is not a financial advisor. Do your research before investing your funds in any financial asset or presented product or event. We are not responsible for your investing results
Image Credit: Shutterstock


Keep in mind that we may receive commissions when you click our links and make purchases. However, this does not impact our reviews and comparisons. We try our best to keep things fair and balanced, in order to help you make the best choice for you.