
It’s a mixed start to the week for the cryptocurrency market. Hedera Hashgraph (HBAR) rose to all-time highs of $0.58 on Sept. 16 from which it declined to enter sideways trading. Though the near-term outlook speaks of consolidation, HBAR retains a bullish bias in the broader picture. At the time of post, HBAR traded at $0.3512, up 2.41% on the day. From Dubai, Beijing, Singapore to new cities in Africa, The sole purpose of a smart city is to optimize city functions and boost economic growth by leveraging cutting-edge technologies. According to Rob Allen, CEO of Nodl, the underlying infrastructure holds the key to success for the incentivization systems and overall integrity of the smart city. Distributed ledger technology promises to be the foundational network layer for systems underpinning financial services, supply chain, interoperable identity systems, and new decentralized economic models. The Hedera public network refers to a distributed ledger technology (DLT) designed for high-volume usages.
Key Levels
Resistance Levels: $0.6000, $0.5000, $0.4000
Support Levels: $0.3000, $0.2500, $0.2000
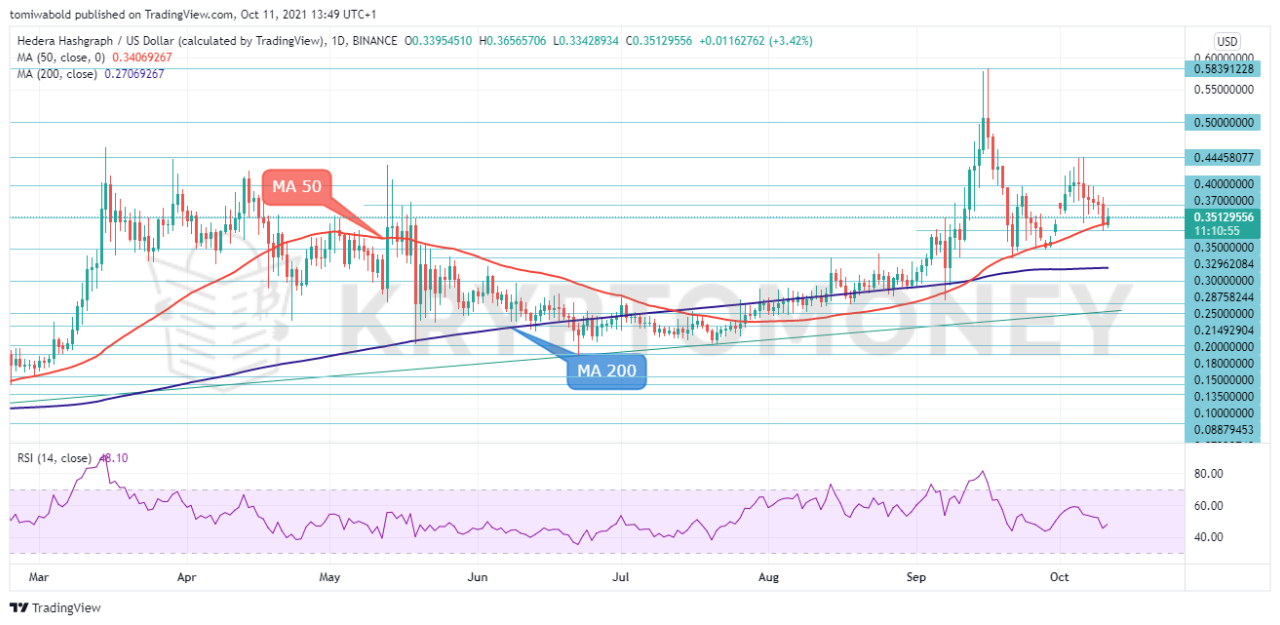 HBAR/USD Daily Chart
HBAR rebounds off yesterday’s low at $0.3296 after a six-day bearish run, the recent faint bullish attempt could still see further continuation according to the technical picture. The bounce off at the MA 50 at $0.3406 which has formed strong support in recent times could signal that buyers could gain confidence in the near term. The $0.40 psychological mark may first attract interest if the positive scenario furthers.
A violation at this point could extend up to the previous high of $0.45 before the price meets the recent all-time highs at$0.58.Otherwise, a dive beneath the MA 50 could send the bears towards the $0.30 level before the $0.27 level which coincides with the 200-day SMA. Any decreases beneath this support could shift the bias to negative, sending the price until the $0.20 handle.
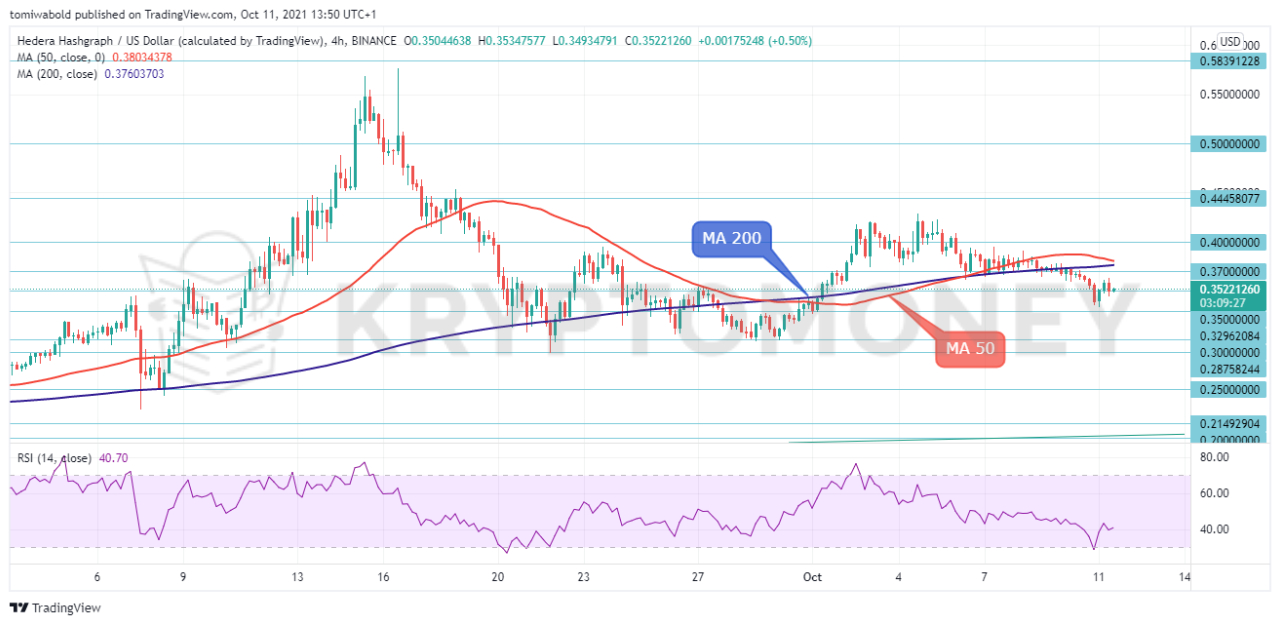 HBAR/USD 4-Hour Chart
On the 4-hour, HBAR has bounced off recent lows around $0.33. A depressed RSI in this major demand area has attracted solid buying interest. The bulls will now have the challenging task of clearing several resistance levels, the first being $0.363 ahead of the $0.376 on the moving average 200. Within breathing distance, the MA 50 at $0.38 could motivate some selling ahead of the $0.39-$0.42 restrictive region.
Should the bulls lose the battle instead, with the price retreating below the 0.33 trough, the next major support could develop around the $0.30 psychological level. Below that, traders may next seek footing around $0.28. To summarize, Hedera remains in a bullish tendency despite the recent consolidation, though a drop below $0.34 could help the bears to take the upper hand.
Note: Kryptomoney.com is not a financial advisor. Do your research before investing your funds in any financial asset or presented product or event. We are not responsible for your investing results
Image Credit: Shutterstock


Keep in mind that we may receive commissions when you click our links and make purchases. However, this does not impact our reviews and comparisons. We try our best to keep things fair and balanced, in order to help you make the best choice for you.
