
The cryptocurrency market is thriving on the current bullish sentiment, with most tokens trading in the green. Hedera Hashgraph (HBAR) remains among the day’s top movers, climbing from lows of $0.163 to highs of $0.221, gaining nearly 35% in the process. At the time of writing, HBAR was trading at $0.185 with a present market capitalization of $1.77 billion. Hedera Hashgraph network recently announced “For #NFTs to go mainstream it’s important to develop a thriving ecosystem around this emerging market and we are excited to be part of Launchpad Luna powered by Animoca brands and global venture accelerator Brinc”. Launchpad Luna, a new accelerator program to identify, mentor, and invest in promising blockchain and non-fungible tokens (NFT) startups will allow funding of up to US$500,000 and end-to-end support.
Key Levels
Resistance Levels: $0.3500, $0.3000, $0.2500
Support Levels: $0.1500, $0.1000, $0.0887
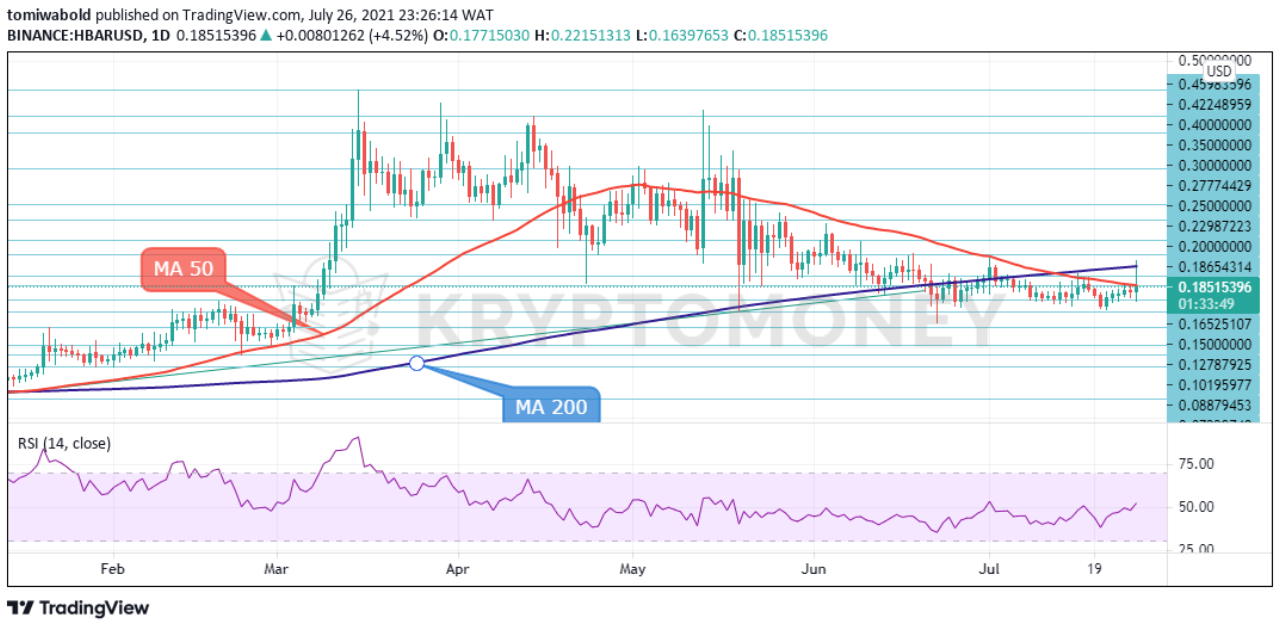 HBAR/USD Daily Chart
Hedera Hashgraph started a fresh increase after testing the $0.152 support on July 21. HBAR price continued to rise, with today’s rally being the biggest since the start of July. There was a break above the MA 50 barrier at $0.1868 while the digital asset traded briefly above the MA 200 resistance, reaching highs of $0.221 on July 26. The momentum indicators are confirming the recent bullish movement with the RSI jumping above the neutral threshold of 50.
A successful attempt above the MA 200 at $0.213 could take the HBAR/USD pair towards the $0.247-$0.306 range before flirting with the $0.38 handle. More increases could send the bulls to retest the $0.42 level ahead of the all-time highs from March at $0.459. Alternatively, a dive beneath the MA 50 at $0.1876 could meet the $0.15-$0.16 support range ahead of the $0.135 low on June 22.
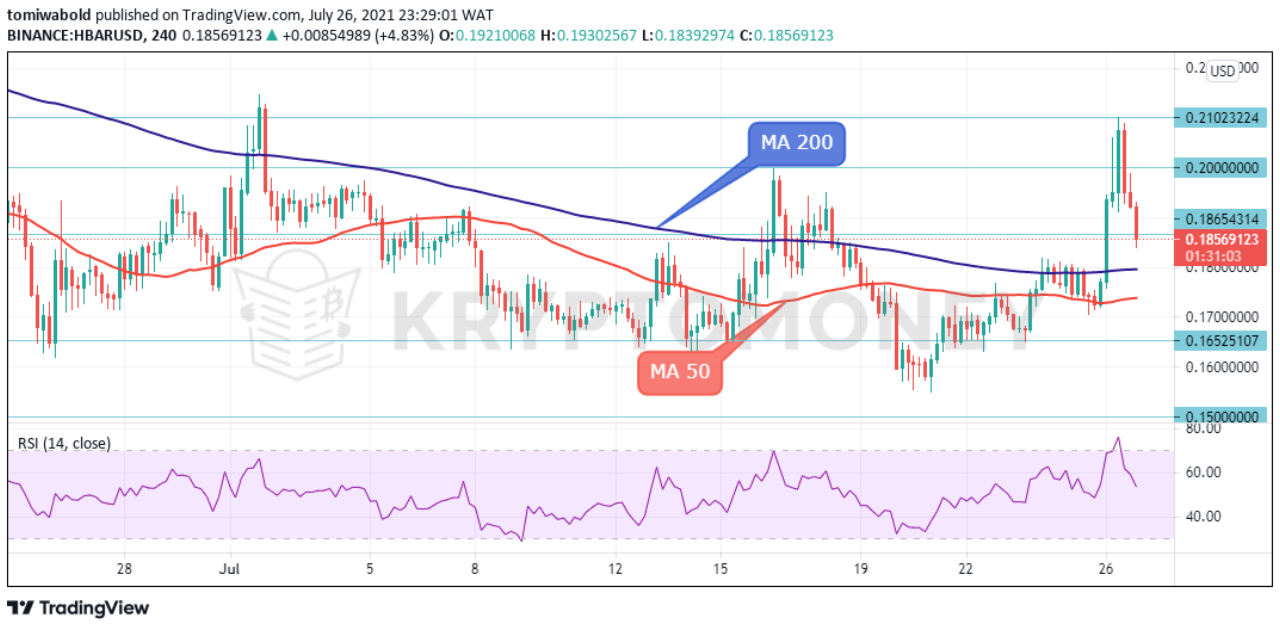 HBAR/USD 4-Hour Chart
Looking at the 4-hours chart, there was a major resistance formed near the $0.221 level resulting in a minor downside correction from the swing high. Despite this, the HBAR/USD pair remains well bid above the $0.179 level or the 4-hour MA 200. There is also immediate support forming near the $0.186 level. Any more losses could lead the pair towards the main support at the MA 200 ($0.179) to reach the MA 50.
If bearish traders plunge beneath the MA 50 currently around $0.1739, the support levels at $0.17, $0.163, and $0.154 may come to the bulls’ rescue. On the upside, the HBAR/USD pair is now trading above the moving averages of 50 and 200. If it remains stable above the MA 200 at $0.179 and above $0.221, there are high chances of more gains towards the $0.30 and $0.40-$0.45 levels. Summarizing, the 4-hour MA 200 ($0.179) marks pivotal support, loss of which would sideline bulls.
Note: Kryptomoney.com is not a financial advisor. Do your research before investing your funds in any financial asset or presented product or event. We are not responsible for your investing results
Image Credit: Twitter


Keep in mind that we may receive commissions when you click our links and make purchases. However, this does not impact our reviews and comparisons. We try our best to keep things fair and balanced, in order to help you make the best choice for you.